Category: Analysis
Inferring Commuter Rail Ridership from Ticket Sales Data
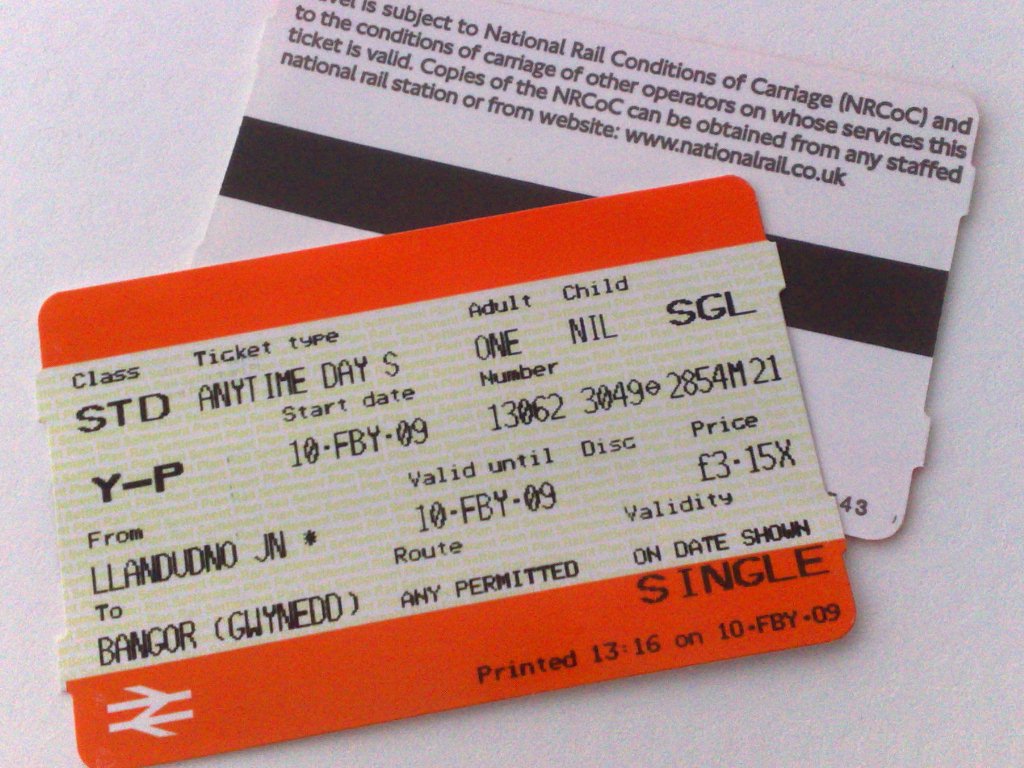 We were tasked by a major commuter rail operator to analyze ticket sales data to determine ridership with origin-destination and time-of-day detail. The operator had four distinct sales channels: mobile ticketing, paper ticket vending machines, monthly direct-mail ticket subscriptions, and on-board sales by train crew. The mobile ticket platform generated the most extensive data, including an activation record each time a periodic pass product or multi-ride carnet was activated. However, this data has a significant sync lag and has only 40% of total market share. The other sales channels provide only point-of-sale data and not point-of-use. We developed a set of working assumptions and built a model that enabled the statistical utilization patterns implied by the mobile ticket users to be applied to the data generated by other sales channels, thereby providing a daily estimate of fifteen-minute resolution ridership demand by origin-destination pairs, a high level of granularity for service planning analysis. However, due to customer-held inventory of multiple-ride paper tickets, previous three months’ worth of paper ticket sales data was necessary to generate ridership estimates for a single day.
Related Publications/Presentations:
Cyclical Track Replacement Process Improvements
 For a railroad infrastructure owner in the United States, we led an effort to examine work constraints resulting in less than ideal throughput of cyclical track program rail and wood tie replacement in continuously-welded rail (CWR) territory by a mechanized track gang. We utilized an eight-step framework consisting of organization, procedure, personnel, time study, rate analysis, utilization analysis, rightsizing, and benchmarking to understand and improve the work process. In the current line-up of track machines, production throughput varied significantly depending on factors such as local track characteristics (e.g. spike versus Pandrol clips), and operator skill. We recommended addition of drilling and screw lagging machines, which could improve gang throughput on curve territory. In this setting, the root cause of low machine utilization are the daily setup/preparation and tear down burden, and mobilization and demobilization at each site. We further recommended task-specialized gangs to ensure optimal machine and personnel mix, sequential work planning to improve machine utilization, and establishment of extra lists based on craft rather than providing protect coverage within each gang.
Related Publications/Presentations:
Automated Daily Analysis of Temporary Speed Restrictions
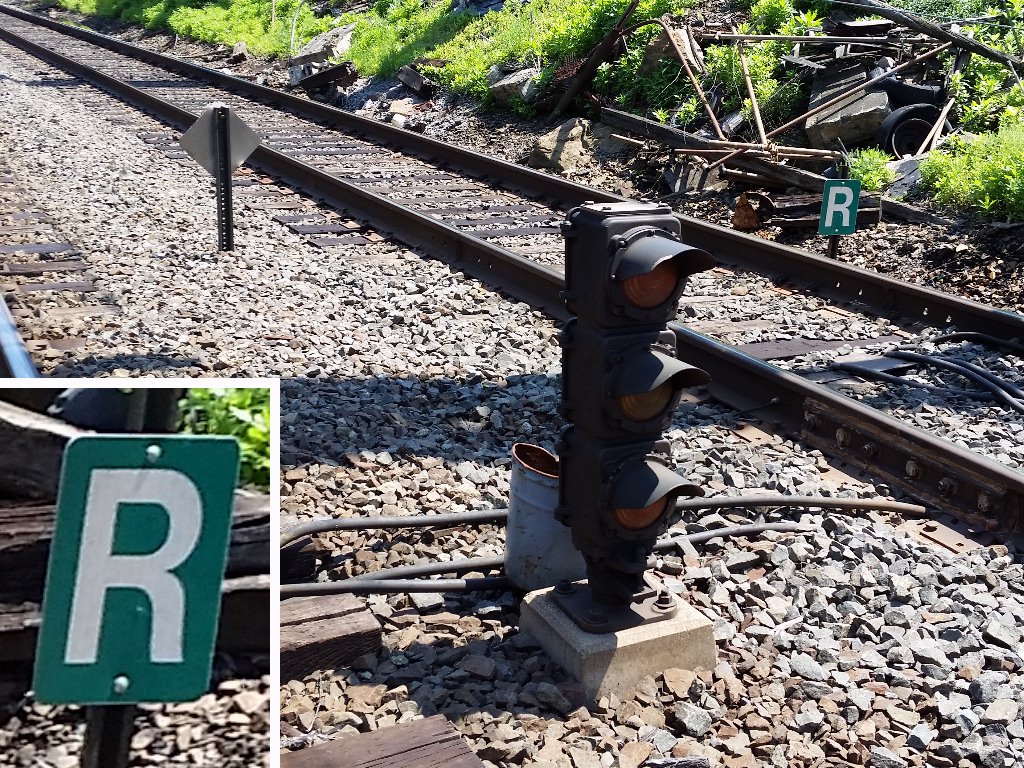 For a regional passenger railroad, we instituted daily automated analysis of temporary speed restrictions (TSRs) to enable senior managers to understand quantitatively the impact that daily and long-term track maintenance work was having on the service. At that time, the railroad had a paper-based process that issued daily TSR bulletins to train & engine employees, but did not systematically capture delays associated with these TSRs. We designed a process that predicted number of trains affected by these TSRs (which may affect only one of four tracks, therefore did not necessarily impact every train passing the location), and a simplified train performance calculator that simulated the effect of braking from normal linespeed, traversing the restriction, accelerating out of it, time required for radio communications, and any nearby station stops that may reduce the resulting delays. This data became an infrastructure performance measure that was monitored by the senior leadership.
Cost Allocation in Shared Major Rail Corridor Assets
 We supported a major user/owner of a shared rail corridor and associated infrastructure during renegotiation of track access charges to determine the equitable sharing of operating and capital costs based on a variety of usage metrics under the prevailing governance framework. Due to legislation changes, all track access agreements in the corridor needed to be renegotiated and the new framework calls for cost allocation based on infrastructure ownership, maintenance and operations responsibility, and usage statistics. We were tasked to collect the necessary data to support such a model, to provide to the corridor-wide coordinating organization for their use. At the same time, we built our own cost-allocation models as a way to forecast the expected cost and revenue impacts of the changes, and to provide a means to verify the reasonableness of cost allocation methods and metrics proposed by others. This work enabled decisionmakers to understand the likely impacts of these changes ahead of official ratification of the new cost sharing framework, and helped to build consensus amongst all stakeholders. Additionally, we utilized a similar methodology when a freight operator (tenant) needed to renegotiate its track access charges due to changing business circumstances, and as a result was able to get the rates being charged closer to the fully allocated cost of operating and maintaining the infrastructure.
Using Train Movement Data for Service Management
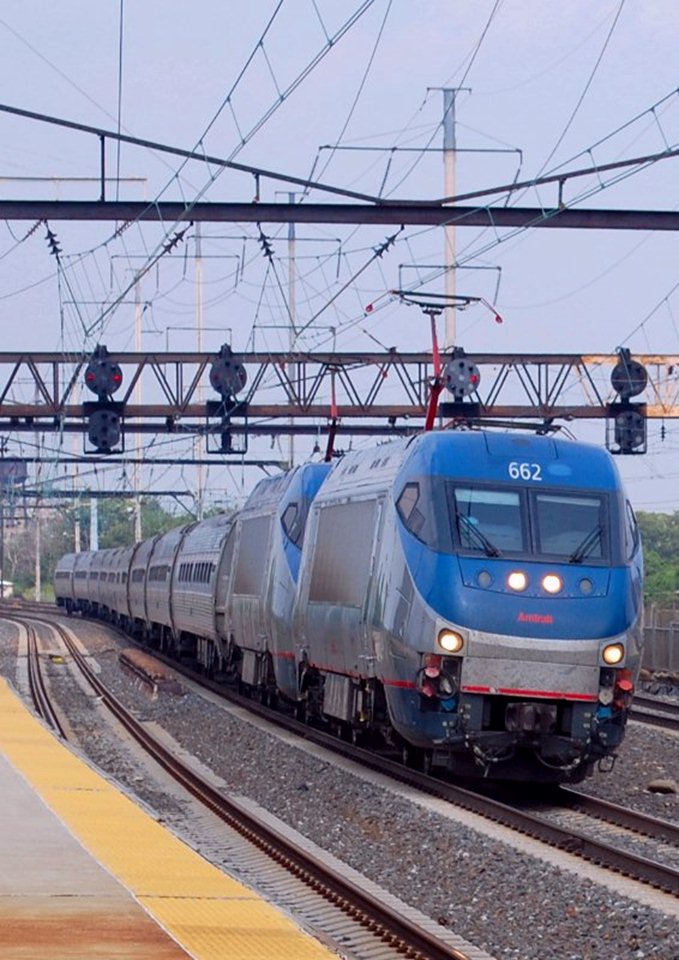
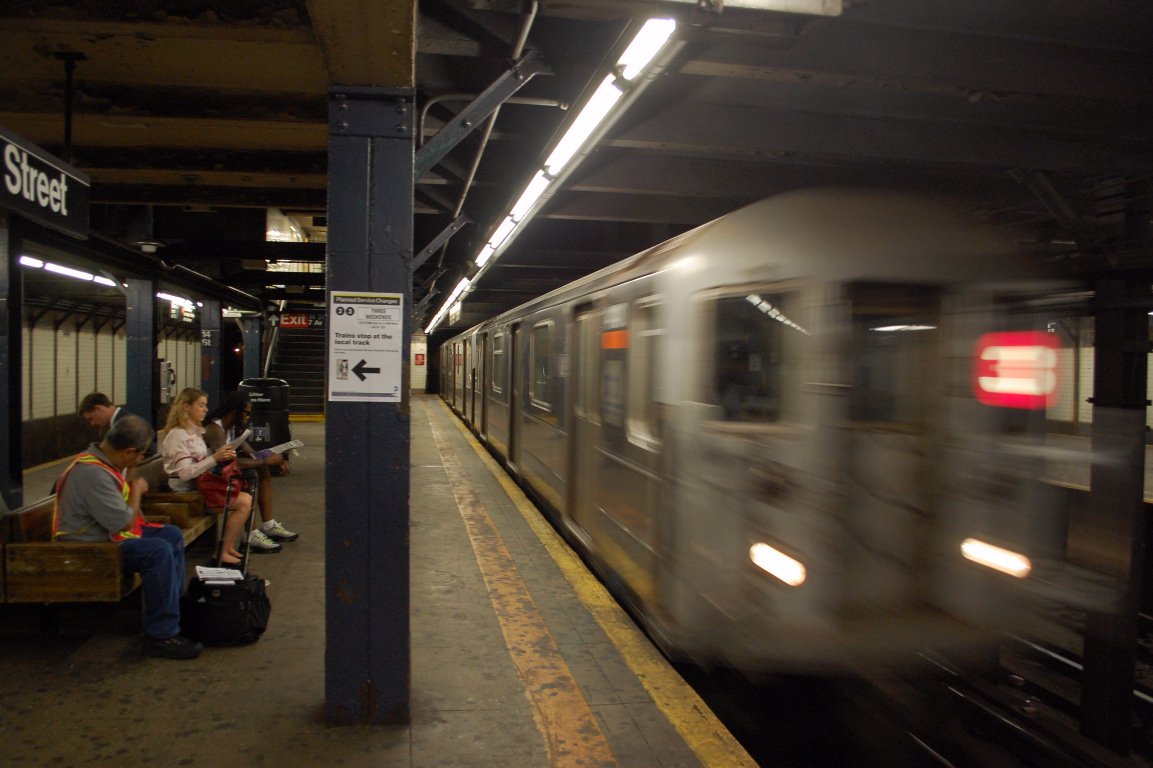 We led the establishment of a program at a large public transit agency to routinely utilize historical and near-real-time train movement data for a variety of ad-hoc analyses in support routine service management and special projects. At that time, a vendor had just completed a major project to connect local control towers on the newer subway lines to a central operations control center, allowing visibility of movements along with train identification from one single database. Working with the vendor and the local I.T. and Signal departments, we arranged for automated nightly export and processing of the data from the isolated rail control network, making it available for routine analysis. One of the first application of this data was to replace the manual and burdensome random sample observations for auditing en-route service reliability with automatically collected data. We also utilized the data to monitor the day-to-day variability of station dwell times during busy periods, terminal departure timeliness, maintenance track outages, and to monitor the performance impacts of major service changes. This pioneering work prompted the agency to explore more of the passively collected data that had been available within their systems, and eventually led to similar projects that took data directly from relay rooms on the older parts of the system.
Related Publications/Presentations:
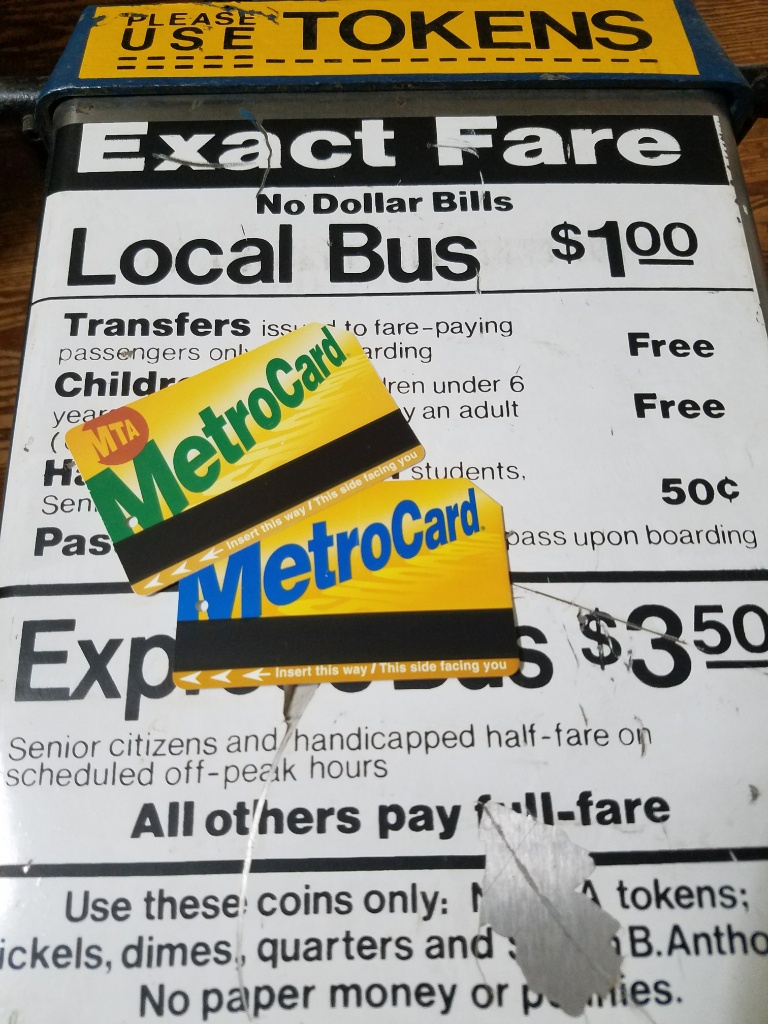
Bus Fare Collection System Audits
 For a large regional bus company, we performed a series of fare payment system related audits to support a number of management initiatives and special projects. In response to a perception that fare abuse is an issue on certain bus routes, we conducted systemwide measurements to estimate the rate of onboard fare evasion with a group of traffic surveyors. To ensure the systemwide rates are correct for revenue loss estimation purposes, we used a stratified sample to ensure proper geographic and temporal coverage. In conjunction with a bus rapid transit line launch featuring offboard fare payment system, we performed before and after studies of unpaid fares, to understand how the changes in fare collection mechanism has affected the rates. To support financial estimates, we designed a study to measure the dollar amounts paid by passengers who paid a partial fare using nearly exhausted farecards or insufficient cash fares. To address an allegation that limited-mobility users were not paying the correct fares, we designed a study specifically to observe wheelchair boardings, which was difficult because it is a relatively rare event widely distributed in time and space. We also designed a study using AFC system data to determine the frequency at which buses were sent from depot with malfunctioning fareboxes, resulting in no fare being collected for that trip. Following the launch of a proof-of-payment system on a bus rapid transit line, we designed a study to measure the effectiveness of the strategies utilized by onboard fare inspection team to ticket nonpaying riders, and provided recommendations on how the fare inspection teams could modify their work schedules and inspection locations to improve both capture rate and rider perception. We also set up a routine process that allowed the bus company to produce a weekly report of rolling average rates of systemwide fare evasion for monitoring by operations management.
Measuring Daily Bus Passenger Miles Using Electronic Farebox Data
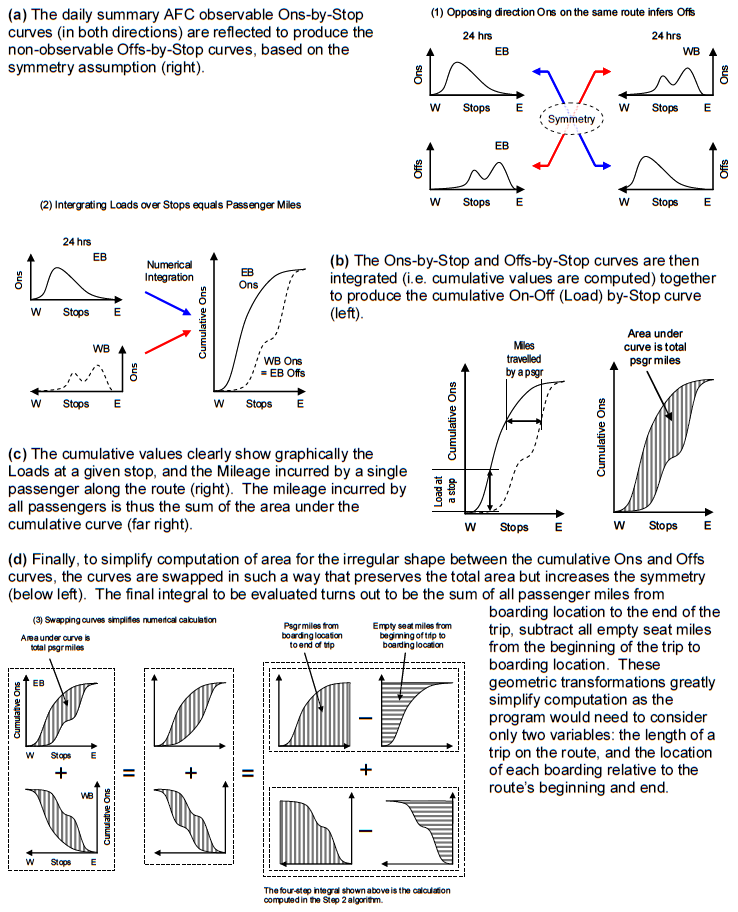 In one of the first production application for extensive analysis of “big” data in a U.S. transit agency, we designed and implemented a user-friendly computer program that automatically detected and corrected inevitable data errors in the daily Automated Fare Collection (AFC) system transaction log files, and devised an algorithm to compute actual aggregate mileage travelled by each individual bus passenger on a zero manual intervention and daily reporting basis. This method was approved by the Federal Transit Administration (FTA) as a 100% sample for bus passenger-miles for National Transit Database reporting and Federal Capital funding purposes, replacing previous labour-intensive random sample practices with higher error margins. At the time, the AFC transaction logs were not broken down by trip, no electronic bus driver sign-on data was available, and no geo-location information was available from the buses. This resulted in various heuristics being necessary to derive the required results. Since that time, the agency has progressively moved towards equipping all buses with automated passenger counters and automated vehicle location systems. However, until 100% of the fleet is fitted with entrance-exit door sensors, this farecard-based method of measuring passenger ridership and passenger-miles remains in daily production use.
Related Publications/Presentations:
Demographic Analyses to Inform Transit Fare Policy
 One major U.S. transit agency was proposing a significant round of fare restructuring in the face of a structural deficit, and many fare policy options were being considered. Some of these proposed fare structures involved significant increases and expected diversions of current customers between different fare products (e.g pay-per-ride tickets, discounted multi-ride tickets, and unlimited ride passes of differing durations), and an option to introduce higher peak fares was being discussed. This type of major change in fare structure was unusual in this metropolitan area and advocates were concerned about its equity impacts, as the proposals had the potential to shift the cost burden between different groups or geographic areas. We were tasked to combine existing fare media usage survey data, customer demographics data, U.S. Census data, and current farecard utilization data to determine impacts to different groups of customers, such as minority or low-income. For this assignment, we came up with two different approaches for impact analyses: a classical aggregate one based on known fare elasticities in the various markets, and an innovative disaggregate one utilizing all observed trips and individually simulating each rider’s choice of fare product based on the new fare structure and their daily travel pattern. From these results, the transit agency was able to choose a fare scenario that delivered the required revenue increases whilst minimizing impacts to protected demographics. These results were also provided to relevant authorities for establishing Title VI compliance of the fare restructuring process.
Related Publications/Presentations:
Developing Performance Measures for a New Management Framework
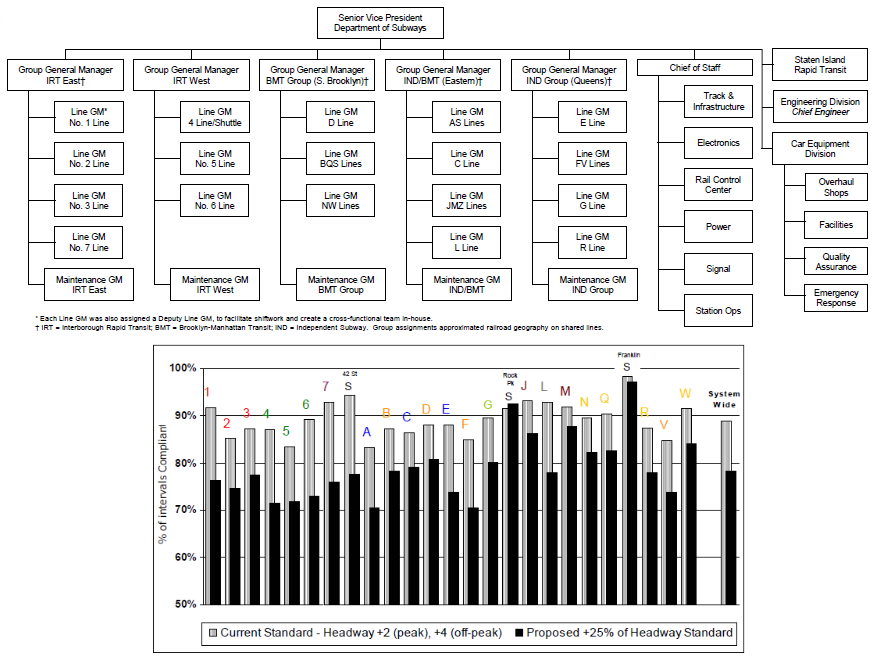 For a large public transit agency, we developed a series of aggregate performance measures using a balanced scorecard framework to support the roll-out of an operations management restructuring programme designed to provide a single point of accountability for service on each rail line. The rail lines have shared track segments where they share stations, and several lines would share major maintenance assets such as workshops. Additionally, trains may be subject to diversion onto other lines in case of operational perturbations, which in some cases are not an unusual occurrence. It was, therefore, necessary to report the composite performance of each line by allocating performance results which may be measured by station, by track segment, or for shared vehicle fleets. We developed a weighting scheme by utilizing usage statistics by line, and by utilizing existing “performance priority” data from a prior customer survey to inform which aspects of performance is more important to the customer (e.g. station cleanliness versus car reliability). This resulted in a composite performance measure which allowed overall performance of all lines to be presented in rank order. While the analytics behind the weighting scheme are not complicated, the most challenging aspect of this project was to gain acceptance of the proposed performance measures amongst the new line general managers whose performance would be so adjudicated, and we consider their acceptance of our proposal an important achievement.
Related Publications/Presentations:
Statistical Sampling for Electronic Toll Road Transaction Audit
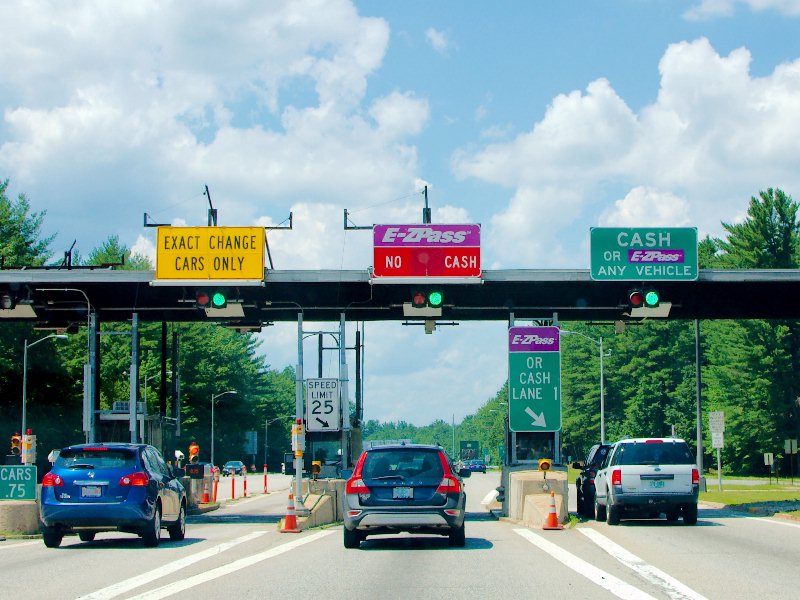
On behalf of the internal audit group at a large regional transportation agency, we designed a stratified statistical sample for determining the true rate of toll evasion on electronic RFID-based toll collection systems. The system is owned by a multi-state consortium, thus subject to interagency settlements, and billing for uncollected tolls had varying degrees of success. At the same time, the agency was actively considering gateless tolling, and thus needed to understand potential revenue losses from different types of toll evasion. Each electronic transaction selected for audit required labourous manual retrieval and review of video footage; at the same time, toll evasion is presumed to be a rare event, making its true rate difficult to determine by statistical sampling. Through the use of statistics, we minimized the number of events that required reviewing but retained confidence in the results, and helped them develop upper and lower bounds for toll evasion rates and resulting revenue losses.
Freight Commodity Flow Modelling and Data Exchange Processing
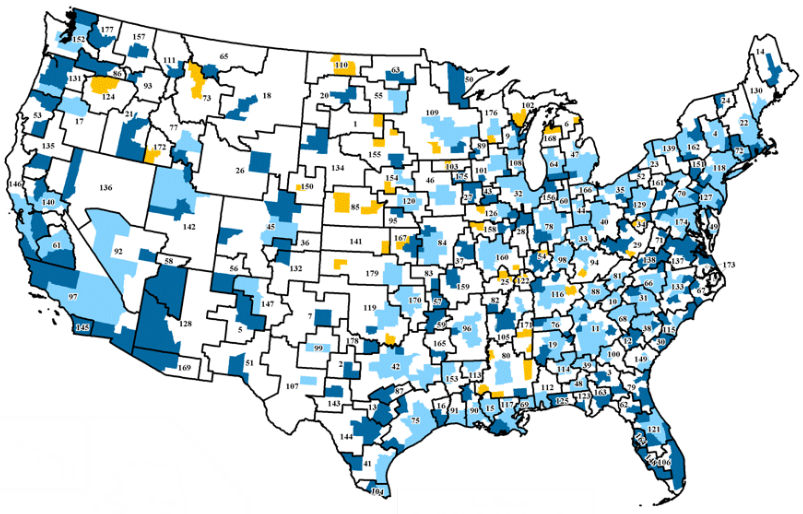 We were data scientists responsible for commodity flow modelling, traffic data processing, and manipulating huge databases for a proprietary freight market intelligence and traffic data tool. This database integrates information from various publicly-available and privately-collected data sources, and provides an overall picture of freight flows within the U.S., at a commodity and county or MSA level of detail. It is a feeder database to many statewide freight plans. To build or update this database, we started with Census data, local economic data, and public railroad waybill sample, and augmented the data with specific information gathered from a proprietary motor carrier data exchange program. Where specific information is not available, the public data is disaggregated or synthesized using established optimization methods, allocation matrices, and gravity-attraction models. We were specifically responsible for the following market segments: agriculture, coal, minerals, air freight, carrier data exchange, and barge transload sectors. We also contributed to the body of modelling knowledge by developing and/or refining new data collection and manipulation methodologies, resulting in continual improvement of the product. This proprietary tool continues to be available on a subscription basis from its owner.
Note: Alex Lu performed this work as an employee of another firm.
Strategic Plans for Rail Freight Business Development
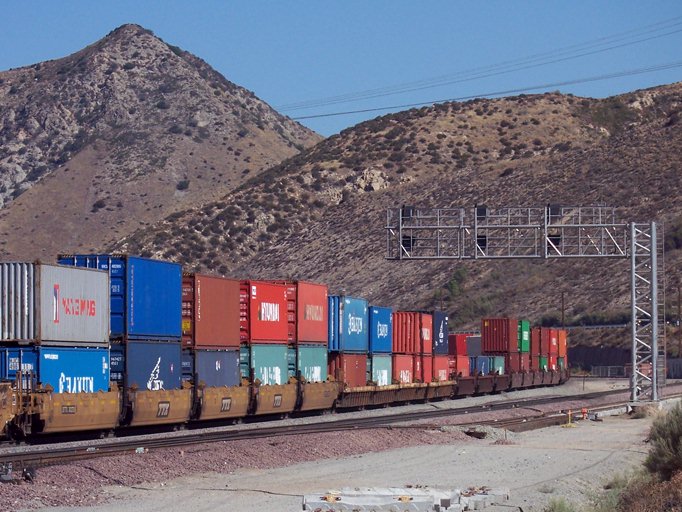
On behalf of a major truckload carrier, we worked with other consultants to develop market demand and existing supplier capacity assessments for a specialized type of intermodal rail freight transport, to determine the likelihood of success that our client would have in launching a service in this specialized market. We also provided various strategies and scenarios as to how this firm can take advantage of the known market conditions to maximize its likelihood of success. Using a proprietary database of freight commodity flows, we also identified corridors where we thought the firm could achieve a high market penetration soon after launch. For an inland port authority, we utilized a similar methodology to determine the market potential of developing an intermodal container service leveraging the port’s strategic geographic location and ready access to multiple major rail carriers. Using the same commodity flow database, we identified containerizable commodities, industrial sectors, and origin-destination lanes and markets where the port could have the best success in targeting new customers for this type of service.
Note: Alex Lu performed this work as an employee of another firm.