Tag: automatic fare collection
Inferring Commuter Rail Ridership from Ticket Sales Data
 We were tasked by a major commuter rail operator to analyze ticket sales data to determine ridership with origin-destination and time-of-day detail. The operator had four distinct sales channels: mobile ticketing, paper ticket vending machines, monthly direct-mail ticket subscriptions, and on-board sales by train crew. The mobile ticket platform generated the most extensive data, including an activation record each time a periodic pass product or multi-ride carnet was activated. However, this data has a significant sync lag and has only 40% of total market share. The other sales channels provide only point-of-sale data and not point-of-use. We developed a set of working assumptions and built a model that enabled the statistical utilization patterns implied by the mobile ticket users to be applied to the data generated by other sales channels, thereby providing a daily estimate of fifteen-minute resolution ridership demand by origin-destination pairs, a high level of granularity for service planning analysis. However, due to customer-held inventory of multiple-ride paper tickets, previous three months’ worth of paper ticket sales data was necessary to generate ridership estimates for a single day.
Related Publications/Presentations:
Business Case for Friday Exception Schedules in Urban Transit
 For a major regional transit authority, we developed a strategic business case for providing separate baseline schedules on Fridays distinct from other weekdays due to significantly different time-of-day and geographical ridership patterns. At that time, regular commuters were trending towards more flexible work scheduling, telecommuting arrangements, and 4½-day weeks especially in the summer, and we observed from Automated Fare Collection (AFC) data that the gaps between midweek and Friday ridership have widened. These Friday exception schedules are not unusual: transit operators ran full Saturday lunchtime rush-hours in the interwar years, while private bus companies, airlines, and freight railroads operate many exceptions today. They can help the operator better match service supply to passenger demand. We found through longitudinal analysis of data that more regular commuters skipped Friday’s trip than other weekdays’. Detailed analysis for 14 representative routes revealed 4.7% lower ridership on Fridays, potentially allowing 7.4% reductions in vehicle-hours operated. Available savings were route-specific, with 25% service reductions possible on some, whereas 25% service fortification was required on leisure-heavy routes having increased Friday ridership. We estimated that implementing separate Friday base schedules systemwide could provide an annual surplus of $10~$17 million for reinvestment elsewhere in the network. From a crewing perspective, we found that the resulting reduced Friday crew requirements could lead to an 1.8% increase in desirable weekend-inclusive regular days-off rosters, and 2.4% reduction in non-preferred midweek days-off rosters. Our recommendation was for the continued implementation of a computerized run-cutting system, and creation of routine analytical processes for multi-variate ridership analysis allowing differences across days, routes, time periods, and other variables to be determined, which together will form the prerequisites for implementing a separate Friday base schedule.
Related Publications/Presentations:
Measuring and Controlling Subway Fare Evasion
 We were tasked by a major U.S. rapid transit system to determine the true rate of fare evasion at the turnstile, and assess the resulting potential revenue loss. Working in conjunction with a team of internal auditors, we adopted a stratified sampling methodology and developed methods for discreet (although not completely clandestine) observations at subway fare control areas. During this project, we discovered that the system in fact had a comprehensive pre-existing framework for managing and combating fare evasion, although it did not report any reliable statistics. The Automated Fare Collection (AFC) system actually features lessons learned from field trials of prototypes specifically designed to limit fare abuse. We found at that time the annual average subway evasion rate remained relatively low at approximately 1.3%, although there were distinct patterns by time of day, type of fare control, rider demographics, and geography. Evasion rate peaks at 3pm due to students dismissal, otherwise hovers around 0.9% peak, 1.9% off-peak. Busy times and locations have higher evasions per hour but lower evasions per passenger. More evasions occur in lower-income neighbourhoods. Staff presence apparently doesn’t reduce evasions. Perhaps counterintuitively, we recommended that fare evasion enforcement should focus on high volume stations and time-of-day to maximize deterrent effect. The transit agency implemented a continuing program to monitor the true rate of fare evasion following this audit, and addressed issues relating to fare structure, probability of enforcement action, versus fixed-penalty fines.
Related Publications/Presentations:
Bus Fare Collection System Audits
 For a large regional bus company, we performed a series of fare payment system related audits to support a number of management initiatives and special projects. In response to a perception that fare abuse is an issue on certain bus routes, we conducted systemwide measurements to estimate the rate of onboard fare evasion with a group of traffic surveyors. To ensure the systemwide rates are correct for revenue loss estimation purposes, we used a stratified sample to ensure proper geographic and temporal coverage. In conjunction with a bus rapid transit line launch featuring offboard fare payment system, we performed before and after studies of unpaid fares, to understand how the changes in fare collection mechanism has affected the rates. To support financial estimates, we designed a study to measure the dollar amounts paid by passengers who paid a partial fare using nearly exhausted farecards or insufficient cash fares. To address an allegation that limited-mobility users were not paying the correct fares, we designed a study specifically to observe wheelchair boardings, which was difficult because it is a relatively rare event widely distributed in time and space. We also designed a study using AFC system data to determine the frequency at which buses were sent from depot with malfunctioning fareboxes, resulting in no fare being collected for that trip. Following the launch of a proof-of-payment system on a bus rapid transit line, we designed a study to measure the effectiveness of the strategies utilized by onboard fare inspection team to ticket nonpaying riders, and provided recommendations on how the fare inspection teams could modify their work schedules and inspection locations to improve both capture rate and rider perception. We also set up a routine process that allowed the bus company to produce a weekly report of rolling average rates of systemwide fare evasion for monitoring by operations management.
Measuring Daily Bus Passenger Miles Using Electronic Farebox Data
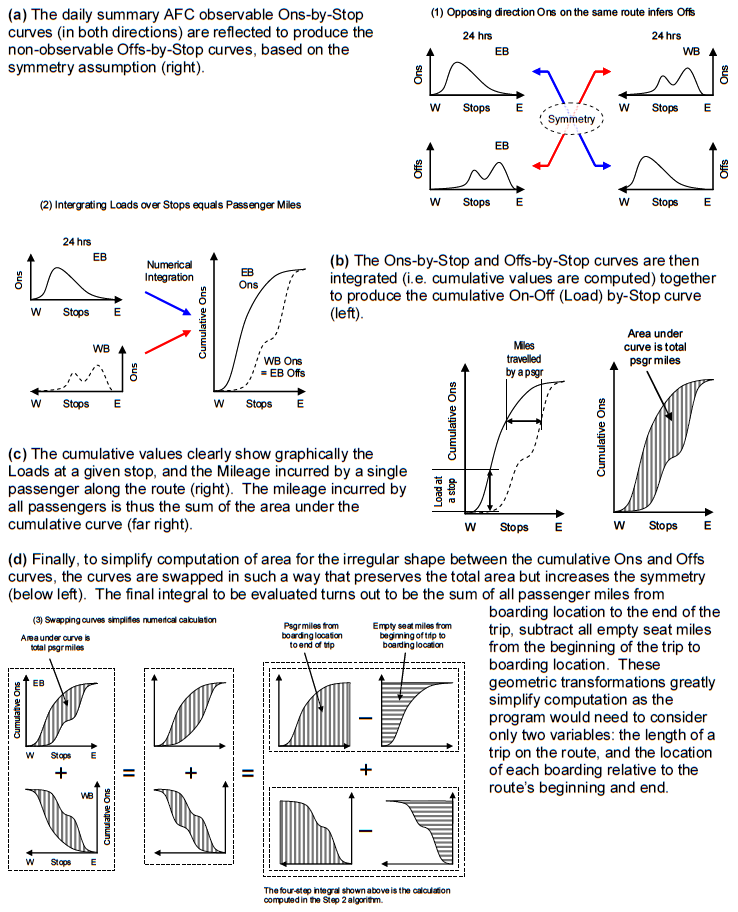 In one of the first production application for extensive analysis of “big” data in a U.S. transit agency, we designed and implemented a user-friendly computer program that automatically detected and corrected inevitable data errors in the daily Automated Fare Collection (AFC) system transaction log files, and devised an algorithm to compute actual aggregate mileage travelled by each individual bus passenger on a zero manual intervention and daily reporting basis. This method was approved by the Federal Transit Administration (FTA) as a 100% sample for bus passenger-miles for National Transit Database reporting and Federal Capital funding purposes, replacing previous labour-intensive random sample practices with higher error margins. At the time, the AFC transaction logs were not broken down by trip, no electronic bus driver sign-on data was available, and no geo-location information was available from the buses. This resulted in various heuristics being necessary to derive the required results. Since that time, the agency has progressively moved towards equipping all buses with automated passenger counters and automated vehicle location systems. However, until 100% of the fleet is fitted with entrance-exit door sensors, this farecard-based method of measuring passenger ridership and passenger-miles remains in daily production use.
Related Publications/Presentations:
Demographic Analyses to Inform Transit Fare Policy
 One major U.S. transit agency was proposing a significant round of fare restructuring in the face of a structural deficit, and many fare policy options were being considered. Some of these proposed fare structures involved significant increases and expected diversions of current customers between different fare products (e.g pay-per-ride tickets, discounted multi-ride tickets, and unlimited ride passes of differing durations), and an option to introduce higher peak fares was being discussed. This type of major change in fare structure was unusual in this metropolitan area and advocates were concerned about its equity impacts, as the proposals had the potential to shift the cost burden between different groups or geographic areas. We were tasked to combine existing fare media usage survey data, customer demographics data, U.S. Census data, and current farecard utilization data to determine impacts to different groups of customers, such as minority or low-income. For this assignment, we came up with two different approaches for impact analyses: a classical aggregate one based on known fare elasticities in the various markets, and an innovative disaggregate one utilizing all observed trips and individually simulating each rider’s choice of fare product based on the new fare structure and their daily travel pattern. From these results, the transit agency was able to choose a fare scenario that delivered the required revenue increases whilst minimizing impacts to protected demographics. These results were also provided to relevant authorities for establishing Title VI compliance of the fare restructuring process.
Related Publications/Presentations: