Tag: big data
Inferring Commuter Rail Ridership from Ticket Sales Data
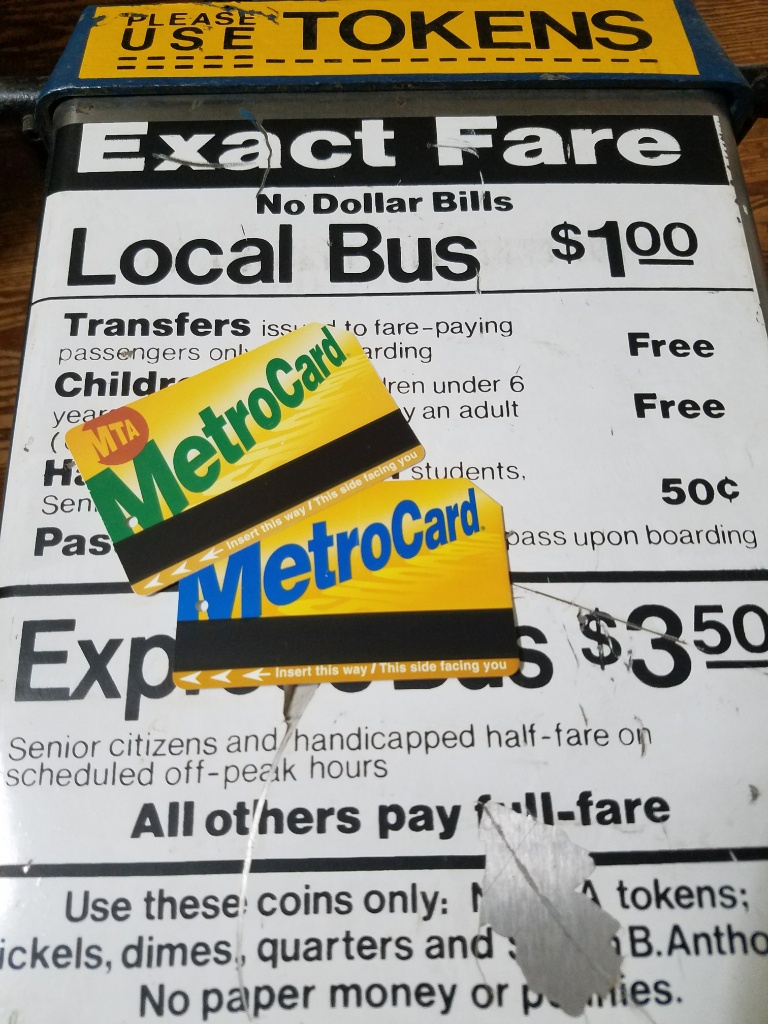
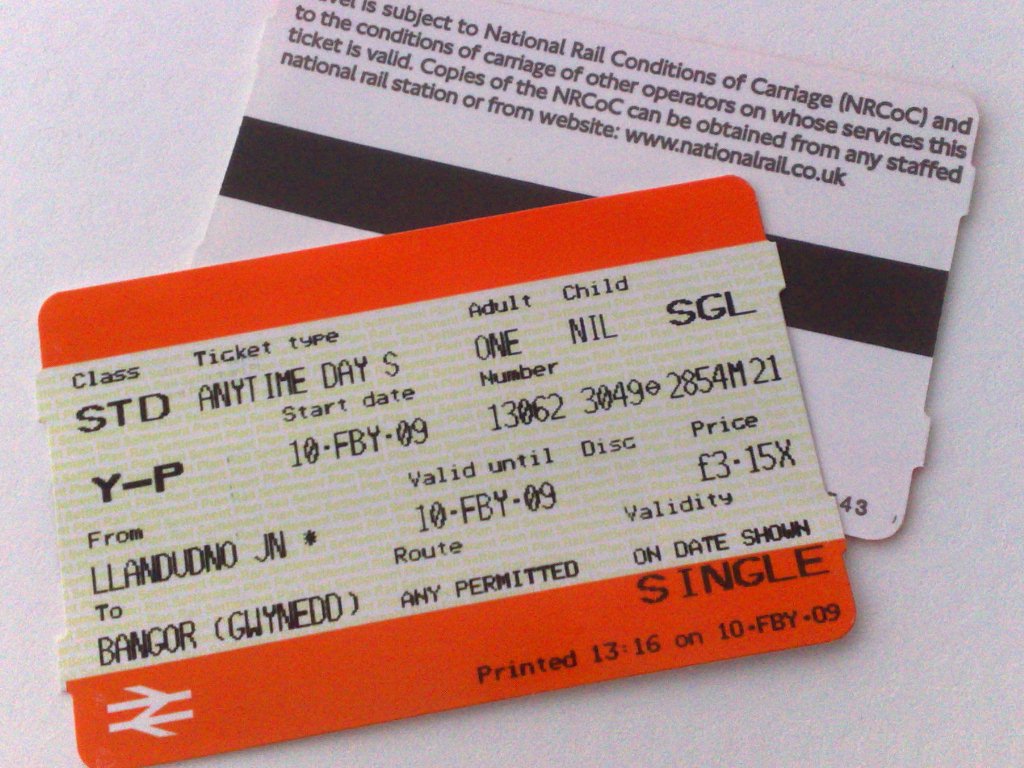 We were tasked by a major commuter rail operator to analyze ticket sales data to determine ridership with origin-destination and time-of-day detail. The operator had four distinct sales channels: mobile ticketing, paper ticket vending machines, monthly direct-mail ticket subscriptions, and on-board sales by train crew. The mobile ticket platform generated the most extensive data, including an activation record each time a periodic pass product or multi-ride carnet was activated. However, this data has a significant sync lag and has only 40% of total market share. The other sales channels provide only point-of-sale data and not point-of-use. We developed a set of working assumptions and built a model that enabled the statistical utilization patterns implied by the mobile ticket users to be applied to the data generated by other sales channels, thereby providing a daily estimate of fifteen-minute resolution ridership demand by origin-destination pairs, a high level of granularity for service planning analysis. However, due to customer-held inventory of multiple-ride paper tickets, previous three months’ worth of paper ticket sales data was necessary to generate ridership estimates for a single day.
Related Publications/Presentations:
Enterprise Geographic Information Systems (GIS) Program Development
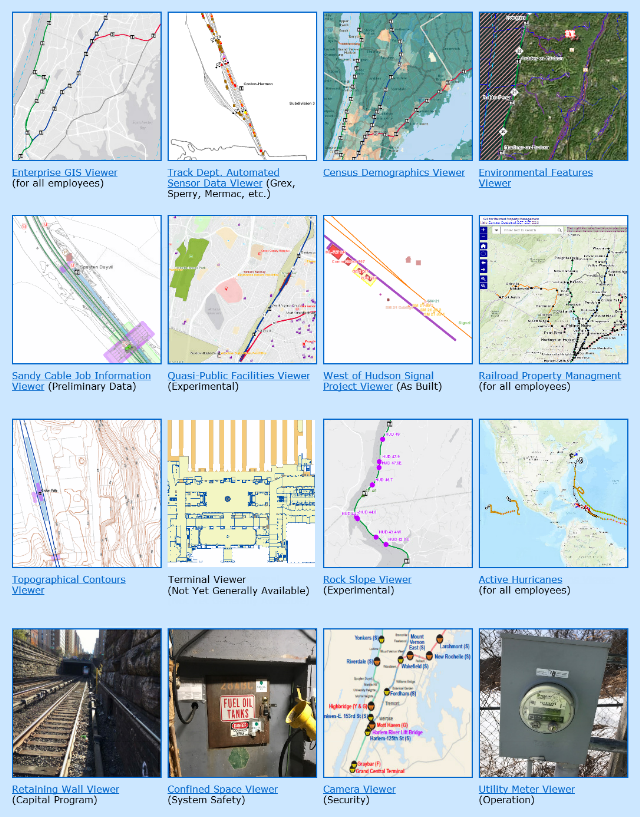 At a major regional railway, we were responsible for developing staffing, organizational structure, and business plans necessary to initiate a companywide Enterprise Geographic Information Systems (GIS) program. We implemented corporate GIS standards, boilerplates, policies, and procedures, and managed the initial bootstrapping phases of the new program, ensuring that necessary I.T. and other resources were secured. We convened an interdisciplinary team of staffers and consultants to develop a concept of operations plan to advance GIS and asset management data collection efforts, and to identify internal mapping and tracking needs that are not currently being fulfilled. This project gathered, imported, and published basic geospatial and infrastructure data (i.e. base map) to fulfill stated business and analytical needs of all departments throughout the railroad. Additionally we scoped out five supporting application development projects, provided their functional specifications, and designed new business processes required to support the elicited user requirements of a number of key railroad departments. The GIS applications included: a property management tool, an electronic track chart, a capital program drawings indexing and retrieval tool, a real-time train-tracking tool for use by field customer service agents, and a planning tool for visualizing travel patterns and traveller demographics. These five GIS applications were progressed through the operating budget justification process, which helped secure $3.8m of Enterprise Asset Management (EAM) funding.
Related Publications/Presentations:
- Geographic Information System Concept of Operations as a First Step Toward Total Enterprise Asset Management
- Enterprise GIS in a Commuter Rail Environment: State-of-Practice at a Major Northeastern Carrier
Point-to-Point Running Time and Schedule Accuracy Analysis
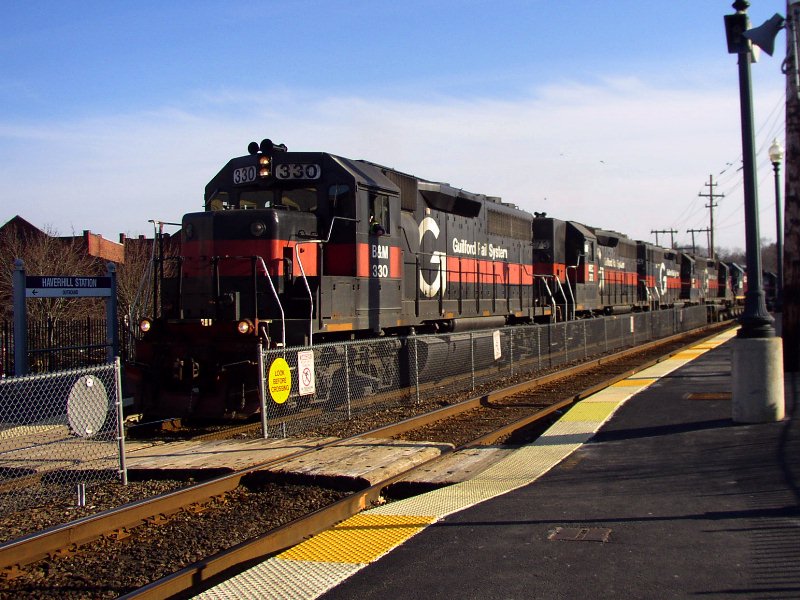
 One major Northeastern passenger railroad had a period during late 2013 when train running times between interlocking control points were changing on a weekly basis due to moving infrastructure upgrade and maintenance projects. We were responsible for the near real-time analysis of track circuit occupancy data from train tracker software to determine whether sufficient running time was being provided in the operating schedules to ensure reliable operation and accurate arrival time predictions. We informed the train scheduling process by provide a scientific basis for running time adjustments by developing lateness, running time, variability, and delay cause analysis, and provided heat-map visualizations for senior management.
Related Publications/Presentations:
Business Case for Friday Exception Schedules in Urban Transit
 For a major regional transit authority, we developed a strategic business case for providing separate baseline schedules on Fridays distinct from other weekdays due to significantly different time-of-day and geographical ridership patterns. At that time, regular commuters were trending towards more flexible work scheduling, telecommuting arrangements, and 4½-day weeks especially in the summer, and we observed from Automated Fare Collection (AFC) data that the gaps between midweek and Friday ridership have widened. These Friday exception schedules are not unusual: transit operators ran full Saturday lunchtime rush-hours in the interwar years, while private bus companies, airlines, and freight railroads operate many exceptions today. They can help the operator better match service supply to passenger demand. We found through longitudinal analysis of data that more regular commuters skipped Friday’s trip than other weekdays’. Detailed analysis for 14 representative routes revealed 4.7% lower ridership on Fridays, potentially allowing 7.4% reductions in vehicle-hours operated. Available savings were route-specific, with 25% service reductions possible on some, whereas 25% service fortification was required on leisure-heavy routes having increased Friday ridership. We estimated that implementing separate Friday base schedules systemwide could provide an annual surplus of $10~$17 million for reinvestment elsewhere in the network. From a crewing perspective, we found that the resulting reduced Friday crew requirements could lead to an 1.8% increase in desirable weekend-inclusive regular days-off rosters, and 2.4% reduction in non-preferred midweek days-off rosters. Our recommendation was for the continued implementation of a computerized run-cutting system, and creation of routine analytical processes for multi-variate ridership analysis allowing differences across days, routes, time periods, and other variables to be determined, which together will form the prerequisites for implementing a separate Friday base schedule.
Related Publications/Presentations:
Using Train Movement Data for Service Management
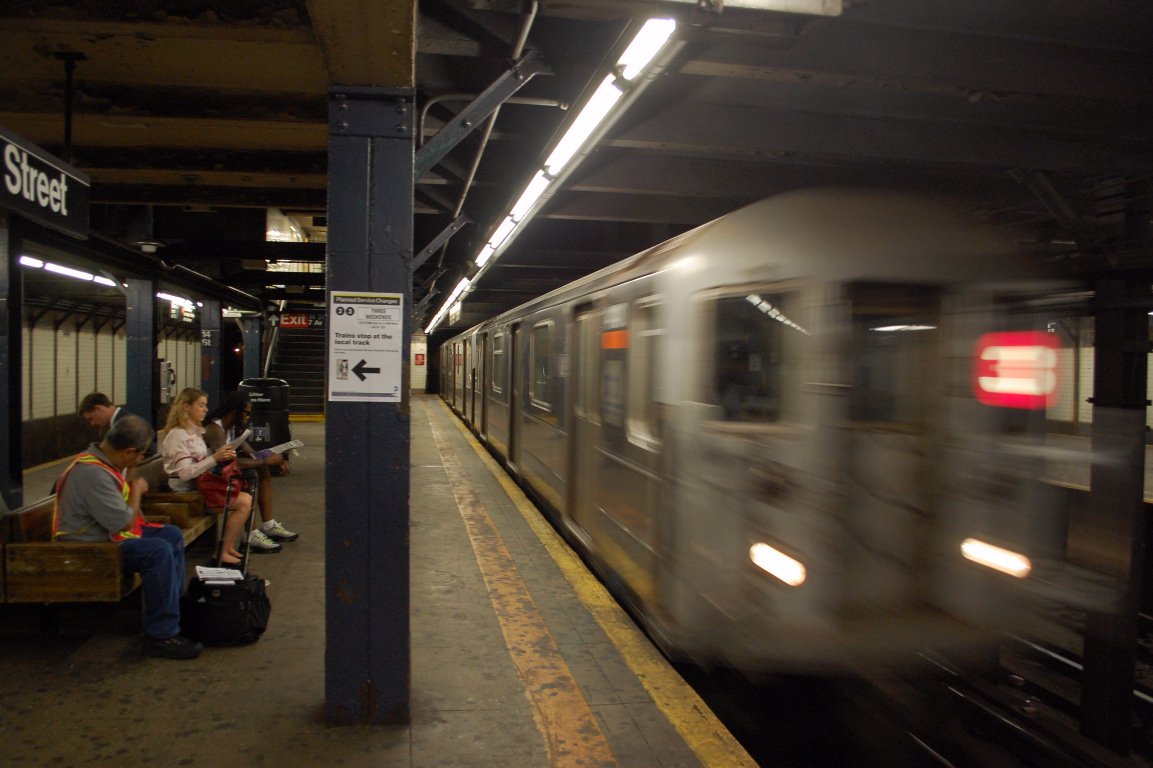 We led the establishment of a program at a large public transit agency to routinely utilize historical and near-real-time train movement data for a variety of ad-hoc analyses in support routine service management and special projects. At that time, a vendor had just completed a major project to connect local control towers on the newer subway lines to a central operations control center, allowing visibility of movements along with train identification from one single database. Working with the vendor and the local I.T. and Signal departments, we arranged for automated nightly export and processing of the data from the isolated rail control network, making it available for routine analysis. One of the first application of this data was to replace the manual and burdensome random sample observations for auditing en-route service reliability with automatically collected data. We also utilized the data to monitor the day-to-day variability of station dwell times during busy periods, terminal departure timeliness, maintenance track outages, and to monitor the performance impacts of major service changes. This pioneering work prompted the agency to explore more of the passively collected data that had been available within their systems, and eventually led to similar projects that took data directly from relay rooms on the older parts of the system.
Related Publications/Presentations:
Measuring Daily Bus Passenger Miles Using Electronic Farebox Data
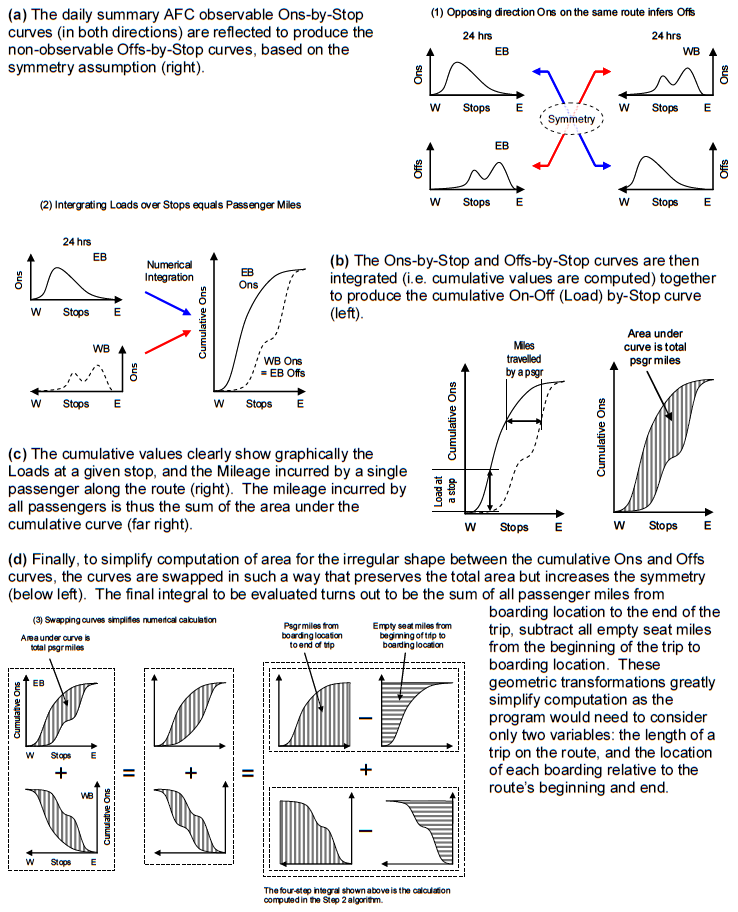 In one of the first production application for extensive analysis of “big” data in a U.S. transit agency, we designed and implemented a user-friendly computer program that automatically detected and corrected inevitable data errors in the daily Automated Fare Collection (AFC) system transaction log files, and devised an algorithm to compute actual aggregate mileage travelled by each individual bus passenger on a zero manual intervention and daily reporting basis. This method was approved by the Federal Transit Administration (FTA) as a 100% sample for bus passenger-miles for National Transit Database reporting and Federal Capital funding purposes, replacing previous labour-intensive random sample practices with higher error margins. At the time, the AFC transaction logs were not broken down by trip, no electronic bus driver sign-on data was available, and no geo-location information was available from the buses. This resulted in various heuristics being necessary to derive the required results. Since that time, the agency has progressively moved towards equipping all buses with automated passenger counters and automated vehicle location systems. However, until 100% of the fleet is fitted with entrance-exit door sensors, this farecard-based method of measuring passenger ridership and passenger-miles remains in daily production use.
Related Publications/Presentations:
Demographic Analyses to Inform Transit Fare Policy
 One major U.S. transit agency was proposing a significant round of fare restructuring in the face of a structural deficit, and many fare policy options were being considered. Some of these proposed fare structures involved significant increases and expected diversions of current customers between different fare products (e.g pay-per-ride tickets, discounted multi-ride tickets, and unlimited ride passes of differing durations), and an option to introduce higher peak fares was being discussed. This type of major change in fare structure was unusual in this metropolitan area and advocates were concerned about its equity impacts, as the proposals had the potential to shift the cost burden between different groups or geographic areas. We were tasked to combine existing fare media usage survey data, customer demographics data, U.S. Census data, and current farecard utilization data to determine impacts to different groups of customers, such as minority or low-income. For this assignment, we came up with two different approaches for impact analyses: a classical aggregate one based on known fare elasticities in the various markets, and an innovative disaggregate one utilizing all observed trips and individually simulating each rider’s choice of fare product based on the new fare structure and their daily travel pattern. From these results, the transit agency was able to choose a fare scenario that delivered the required revenue increases whilst minimizing impacts to protected demographics. These results were also provided to relevant authorities for establishing Title VI compliance of the fare restructuring process.
Related Publications/Presentations:
Freight Commodity Flow Modelling and Data Exchange Processing
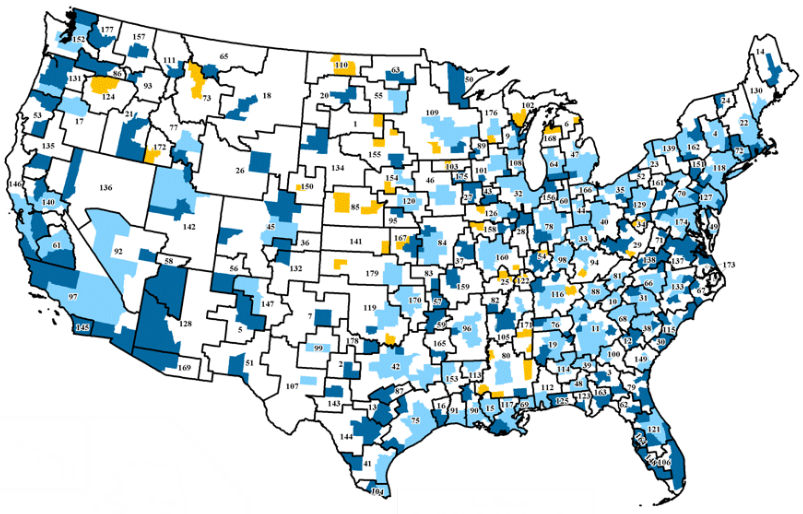 We were data scientists responsible for commodity flow modelling, traffic data processing, and manipulating huge databases for a proprietary freight market intelligence and traffic data tool. This database integrates information from various publicly-available and privately-collected data sources, and provides an overall picture of freight flows within the U.S., at a commodity and county or MSA level of detail. It is a feeder database to many statewide freight plans. To build or update this database, we started with Census data, local economic data, and public railroad waybill sample, and augmented the data with specific information gathered from a proprietary motor carrier data exchange program. Where specific information is not available, the public data is disaggregated or synthesized using established optimization methods, allocation matrices, and gravity-attraction models. We were specifically responsible for the following market segments: agriculture, coal, minerals, air freight, carrier data exchange, and barge transload sectors. We also contributed to the body of modelling knowledge by developing and/or refining new data collection and manipulation methodologies, resulting in continual improvement of the product. This proprietary tool continues to be available on a subscription basis from its owner.
Note: Alex Lu performed this work as an employee of another firm.
Track Density (Tonnage) Estimation for Commuter Railroad
 Commuter railroads do not typically consider their output in terms of million gross tons (MGTs) carried, and typically have negligible freight activity. However, tonnage estimations can be important for assessing turnout and curve rail replacement, and resurfacing needs. On behalf of an infrastructure owner of mixed-traffic trackage in a commuter district, we estimated the track density on a track and block level. Starting with electronic train movement records, we designed a heuristic to automatically filter out questionable data, and provide reasonable estimates for use in their place. This was then combined with planned train-level consist data and seated-load gross equipment weights to determine MGTs attributable to passenger trains and EMU equipment. For road freight trains, we used one year’s worth of freight train manifests to determine tonnage carried, marrying this with train movement data to determine their routing. For unit trains (that load or unload within the territory), and local trains (that pick-up and set-out loads within the territory—negligible volumes), we tracked the tonnage changes en-route where this was deemed a significant factor in the total MGT estimate. On several mainline track segments, freight MGT was found to be between 30%~35% of total MGT and a significant contributor to track wear, despite this being a very busy commuter district that only saw 4~7 road freight trains per day (compared to upwards of 800 daily commuter train-starts). This finding triggered additional management interest in freight activity.
Freight Tenant WILD and Manifest Data Processing
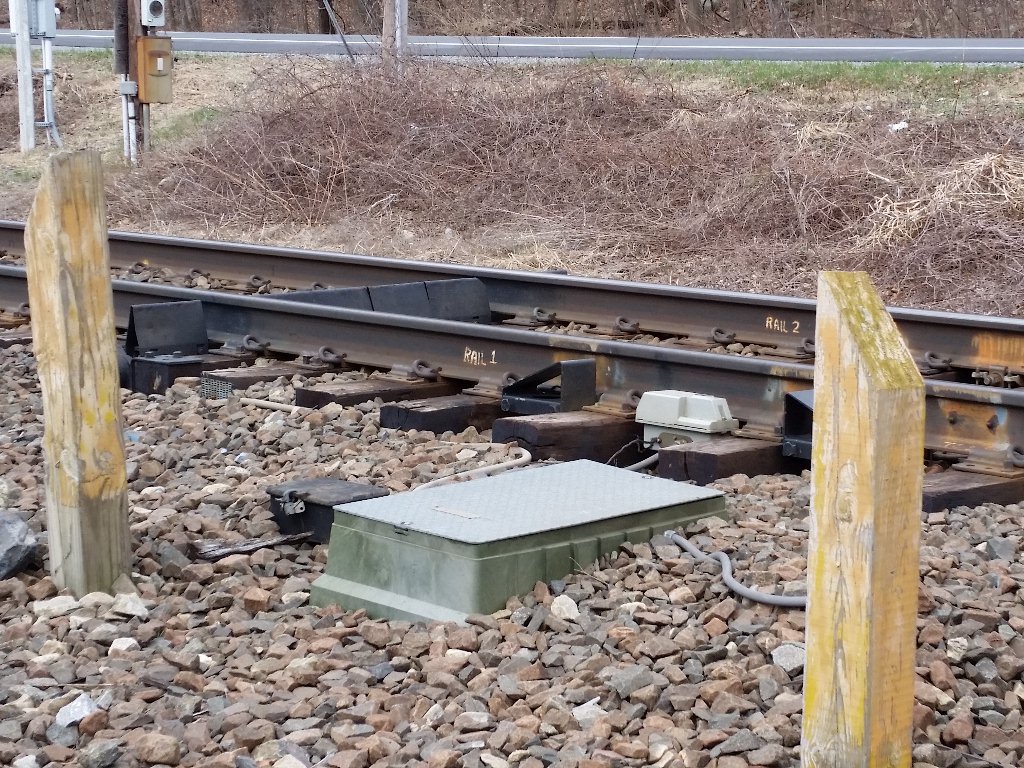 For a passenger railway that hosted a number of freight track-rights tenant operators, we served as the business representative on a multilateral project to install wayside Wheel Impact Load Detectors (WILD) and utilize that data for operational purposes (alerts, audits, billing, etc.) The project involved providing the real-time information to the operations control centre (OCC) such that decisions can be made about whether the freight train is permitted to enter the passenger rail territory, and also matching real-time WILD data to a nightly freight manifest export for audit and billing purposes. We were able to design a fuzzy algorithm that matches the WILD data (containing only car IDs, and only some of the time) to the Manifest data (having train IDs, but not always accurate, and often contains ‘complications’ such as cars being dropped off or picked-up en-route, on both scheduled and unscheduled bases). This project improved the accuracy of the Manifest data being transmitted by tenant railroads, and reduced the instances of overweight cars, which indirectly contributed to improved host-tenant relationship.