Tag: operations performance
Automated Daily Analysis of Temporary Speed Restrictions
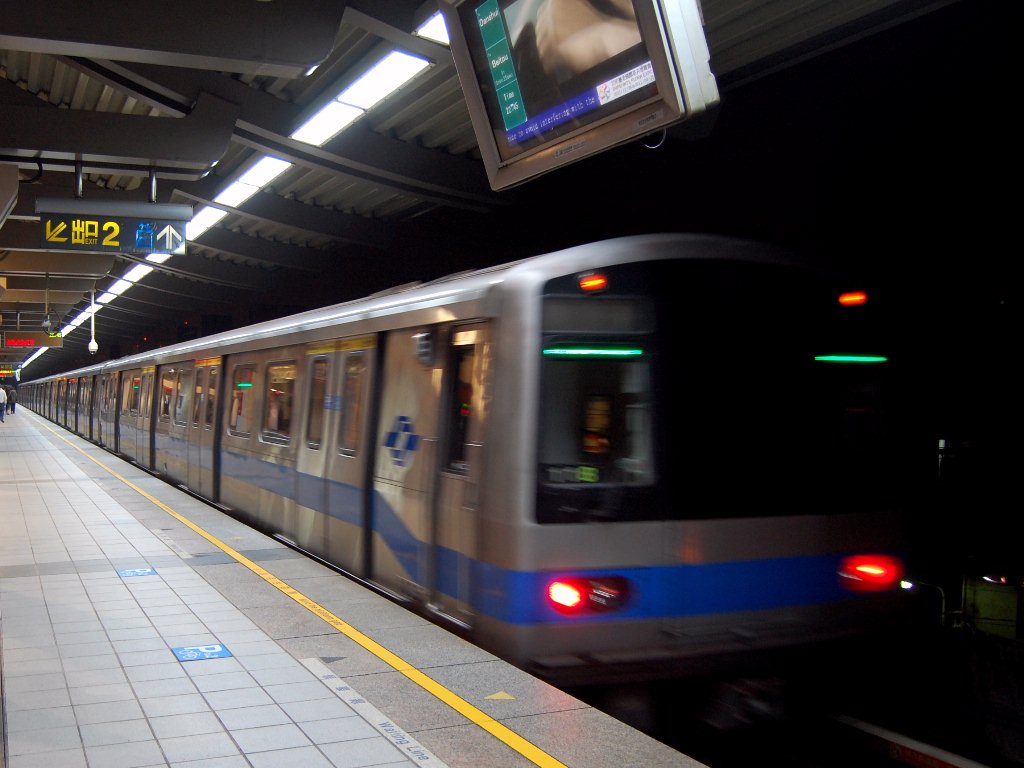
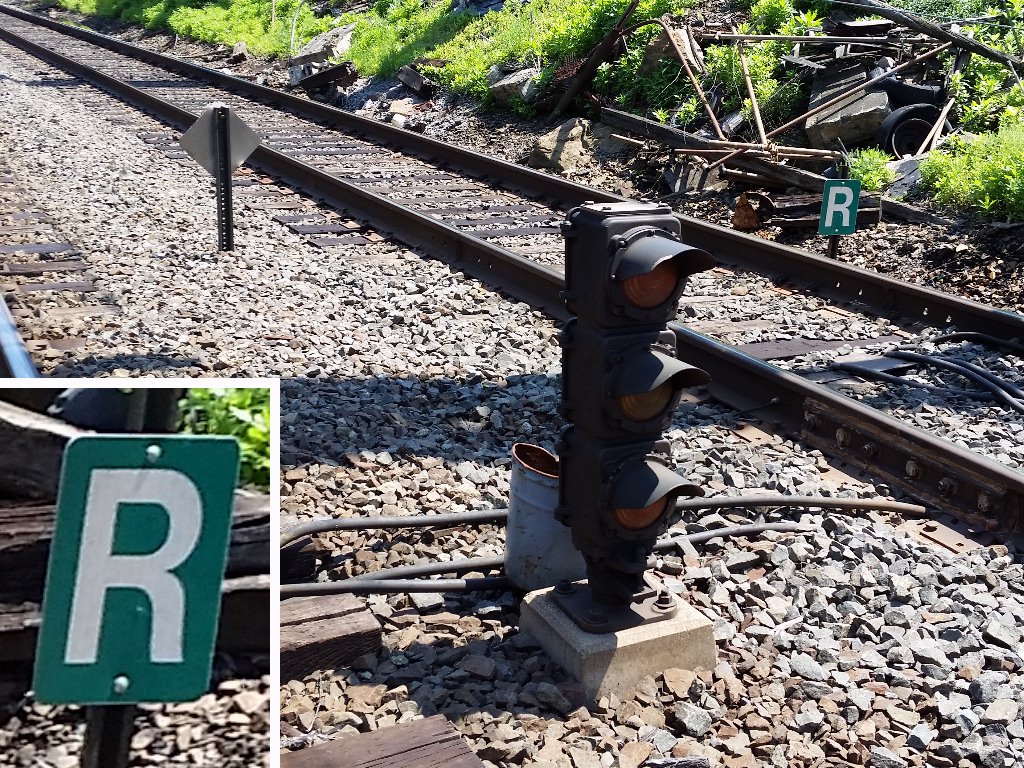 For a regional passenger railroad, we instituted daily automated analysis of temporary speed restrictions (TSRs) to enable senior managers to understand quantitatively the impact that daily and long-term track maintenance work was having on the service. At that time, the railroad had a paper-based process that issued daily TSR bulletins to train & engine employees, but did not systematically capture delays associated with these TSRs. We designed a process that predicted number of trains affected by these TSRs (which may affect only one of four tracks, therefore did not necessarily impact every train passing the location), and a simplified train performance calculator that simulated the effect of braking from normal linespeed, traversing the restriction, accelerating out of it, time required for radio communications, and any nearby station stops that may reduce the resulting delays. This data became an infrastructure performance measure that was monitored by the senior leadership.
Point-to-Point Running Time and Schedule Accuracy Analysis
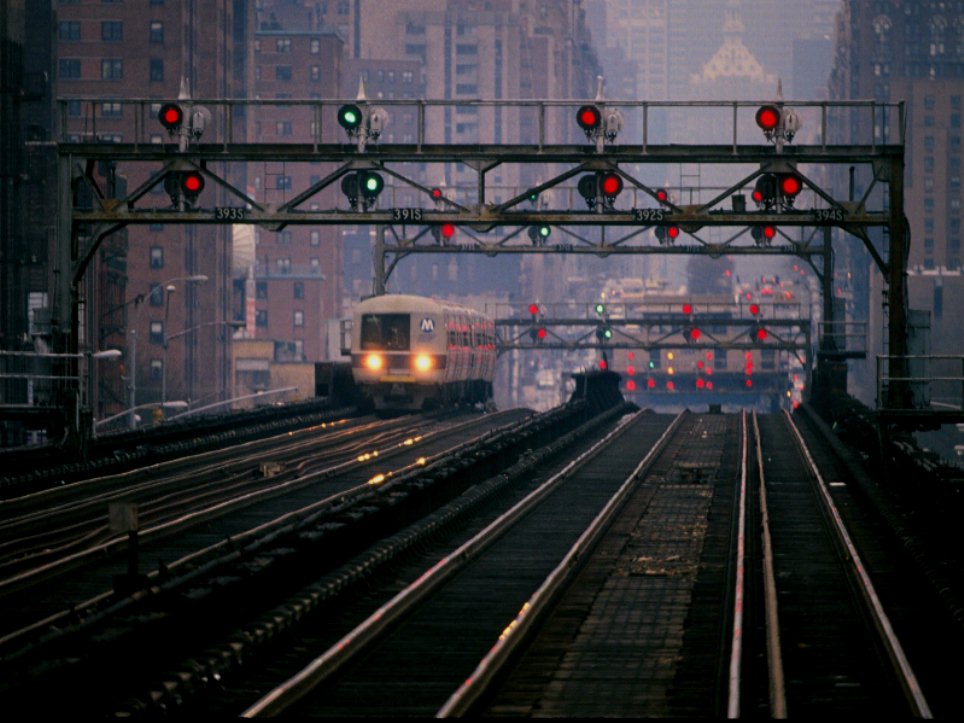 One major Northeastern passenger railroad had a period during late 2013 when train running times between interlocking control points were changing on a weekly basis due to moving infrastructure upgrade and maintenance projects. We were responsible for the near real-time analysis of track circuit occupancy data from train tracker software to determine whether sufficient running time was being provided in the operating schedules to ensure reliable operation and accurate arrival time predictions. We informed the train scheduling process by provide a scientific basis for running time adjustments by developing lateness, running time, variability, and delay cause analysis, and provided heat-map visualizations for senior management.
Related Publications/Presentations:
Using Train Movement Data for Service Management
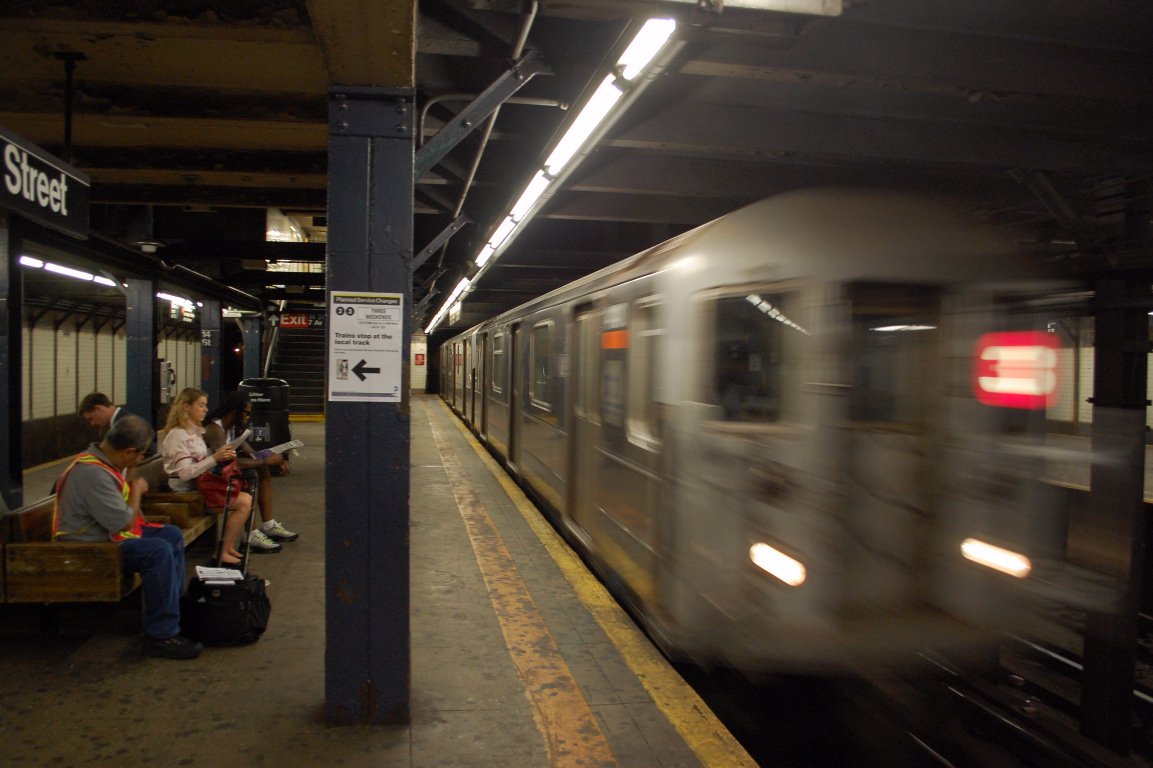 We led the establishment of a program at a large public transit agency to routinely utilize historical and near-real-time train movement data for a variety of ad-hoc analyses in support routine service management and special projects. At that time, a vendor had just completed a major project to connect local control towers on the newer subway lines to a central operations control center, allowing visibility of movements along with train identification from one single database. Working with the vendor and the local I.T. and Signal departments, we arranged for automated nightly export and processing of the data from the isolated rail control network, making it available for routine analysis. One of the first application of this data was to replace the manual and burdensome random sample observations for auditing en-route service reliability with automatically collected data. We also utilized the data to monitor the day-to-day variability of station dwell times during busy periods, terminal departure timeliness, maintenance track outages, and to monitor the performance impacts of major service changes. This pioneering work prompted the agency to explore more of the passively collected data that had been available within their systems, and eventually led to similar projects that took data directly from relay rooms on the older parts of the system.
Related Publications/Presentations:
Developing Performance Measures for a New Management Framework
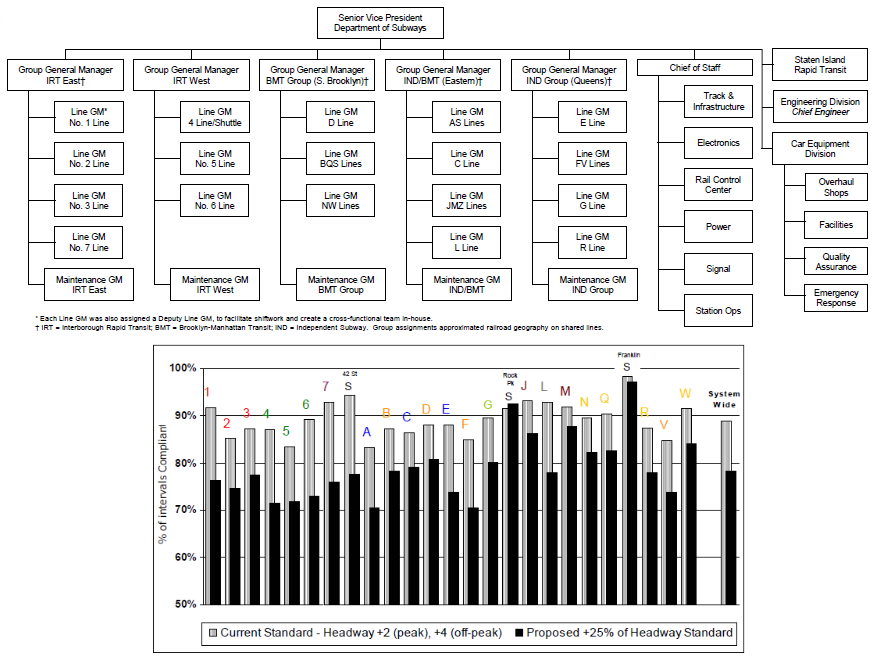 For a large public transit agency, we developed a series of aggregate performance measures using a balanced scorecard framework to support the roll-out of an operations management restructuring programme designed to provide a single point of accountability for service on each rail line. The rail lines have shared track segments where they share stations, and several lines would share major maintenance assets such as workshops. Additionally, trains may be subject to diversion onto other lines in case of operational perturbations, which in some cases are not an unusual occurrence. It was, therefore, necessary to report the composite performance of each line by allocating performance results which may be measured by station, by track segment, or for shared vehicle fleets. We developed a weighting scheme by utilizing usage statistics by line, and by utilizing existing “performance priority” data from a prior customer survey to inform which aspects of performance is more important to the customer (e.g. station cleanliness versus car reliability). This resulted in a composite performance measure which allowed overall performance of all lines to be presented in rank order. While the analytics behind the weighting scheme are not complicated, the most challenging aspect of this project was to gain acceptance of the proposed performance measures amongst the new line general managers whose performance would be so adjudicated, and we consider their acceptance of our proposal an important achievement.
Related Publications/Presentations:
International Metro Benchmarking on Governance Frameworks
 As a spin-off of a national research and training program, we were tasked to determine through publicly available information why many South East Asian transit properties visited by the program delegation have reportedly positive cash flows, i.e. are “profitable”. We found through a detailed comparative analysis of demand densities, asset utilization, regulatory frameworks, performance regimes, operating practices, and softer cultural factors that in fact only the “prudent commercial” portion of the Hong Kong Mass Transit Railway were profitable in the purest sense where farebox revenues exceeded operating expense plus the long term cost of capital renewal. In other cities, the operators are more akin to concessioned carriers or management contractors where at least some infrastructure costs were separated from the operating entity using a variety of financial devices. These systems also received various real estate grants in transactions reminiscent of U.S. “land grant” railroads and have more autonomy and commercial freedom to develop their transit-oriented property holdings. Large metro systems in the U.S. had made network design choices with consequences in density and utilization, which explain some of the higher productivities observed in Asia. We conclude that direct comparisons in performance, profitability, and productivity should be avoided unless care is taken to analyze impacts of governance, social contexts, design criteria, and reasons for these differences. Nonetheless, we believe benchmarking exercises can yield valuable insights for operations improvement under prevailing local constraints.
Related Publications/Presentations:
Management Support for Stop Elimination and Performance Initiatives
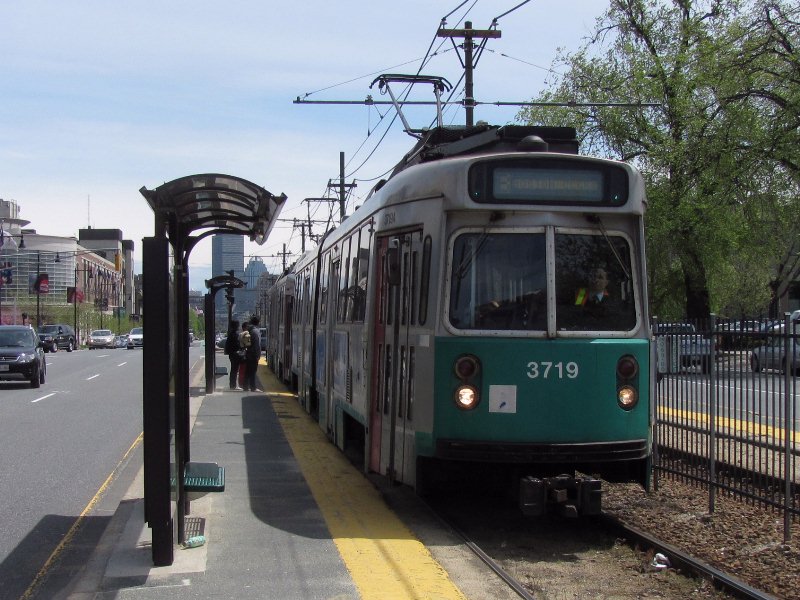
For a multi-model regional transit authority, we provided analytical and project support for a line manager who sought to accomplish two goals: eliminate several underutilized stops on a trolley line, and improve en-route timekeeping at key interchange stations. We identified the target stops to be eliminated using a composite scoring method on several criteria: daily patronage, distance to adjacent alternative stops, and proximity to major demand generators that serves limited-mobility populations. Stops that we identified were subject to a closure process beginning with six month temporary service suspension following public consultation. For on-time performance improvements, we designed schedule “paddles” similar to those carried by railroad enginemen in Asia, which provided quick reference of scheduled times at intermediate timing points. We also provided updated “simplifier” sheets to en-route supervisors (similar to a pre-printed train register), which made it easier for each supervisor to determine whether a trolley was running early or late at their location, or if an interval had been missed entirely by the departure terminal. The on-time performance initiatives proved too resource-heavy for production implementation, however, the elimination of underutilized stops did result in slight journey time improvements with minimal impact to total ridership.
Freight Tenant WILD and Manifest Data Processing
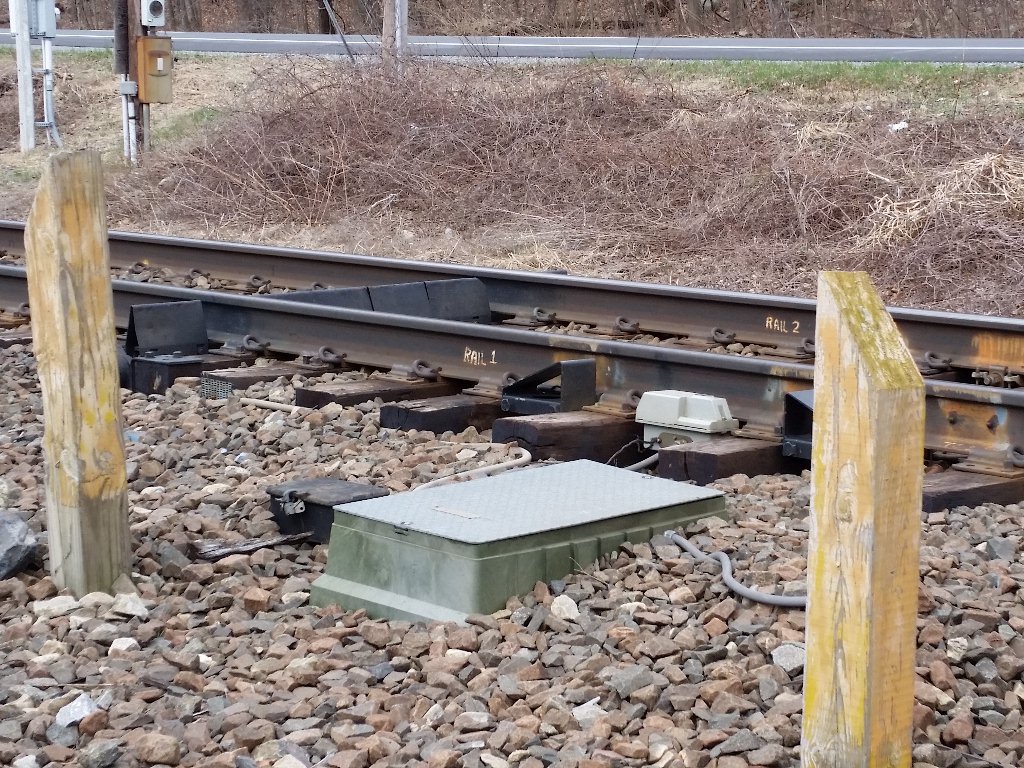 For a passenger railway that hosted a number of freight track-rights tenant operators, we served as the business representative on a multilateral project to install wayside Wheel Impact Load Detectors (WILD) and utilize that data for operational purposes (alerts, audits, billing, etc.) The project involved providing the real-time information to the operations control centre (OCC) such that decisions can be made about whether the freight train is permitted to enter the passenger rail territory, and also matching real-time WILD data to a nightly freight manifest export for audit and billing purposes. We were able to design a fuzzy algorithm that matches the WILD data (containing only car IDs, and only some of the time) to the Manifest data (having train IDs, but not always accurate, and often contains ‘complications’ such as cars being dropped off or picked-up en-route, on both scheduled and unscheduled bases). This project improved the accuracy of the Manifest data being transmitted by tenant railroads, and reduced the instances of overweight cars, which indirectly contributed to improved host-tenant relationship.