Tag: subway
Observational Study of Subway Customer Seat Preferences
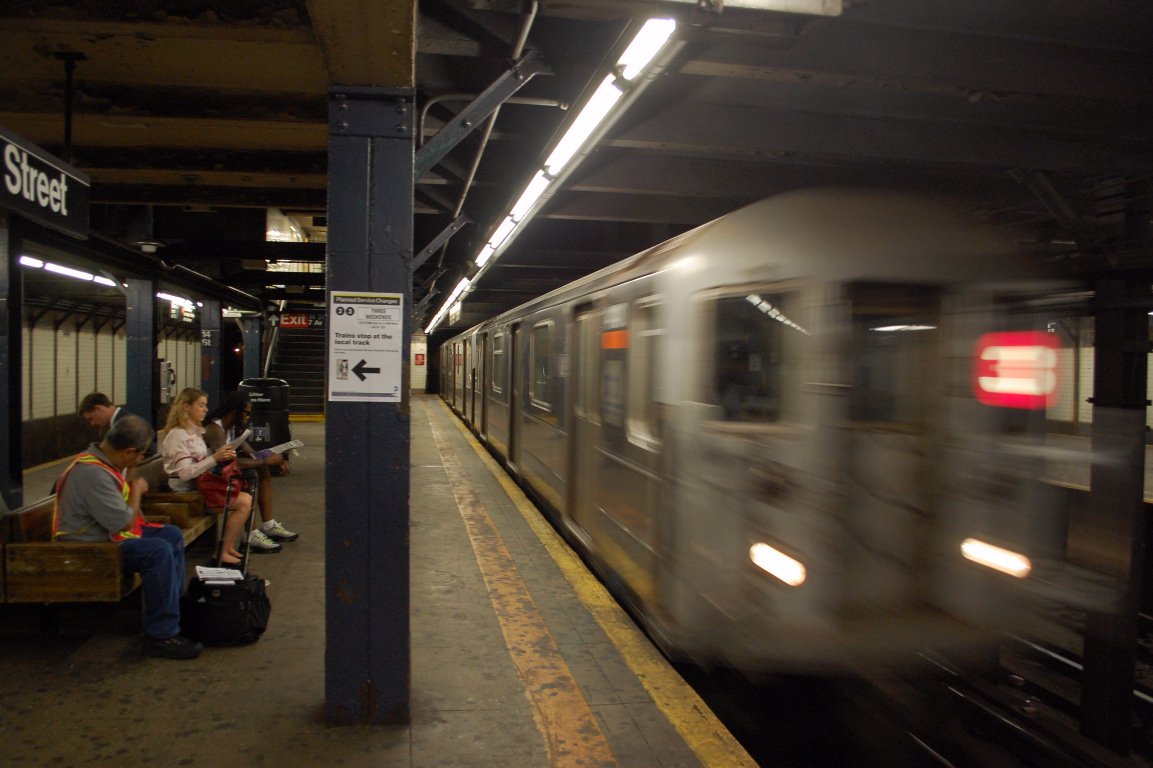
 For a major metro system, we performed an observational study of how customers tended to distribute themselves within each vehicle, with a view towards making recommendations about vehicle design (e.g. door, pole, and seat placement), and to reduce station dwell time. The plastic bench seats installed are otherwise highly homogeneous, but we identified special attributes such as adjacency to doors, whether a partition was present, or if the seating was longitudinal, transverse, facing or back to the direction of travel, and discovered patterns in customer seat choice. Results, based on seating- and standing-room occupancy probability statistics, show customers generally prefer seats adjacent to doors, no real preference for seats adjacent to support stanchions, but active disdain for bench spots between two other seats. On cars featuring transverse seating, customers prefer window seats, but have almost equal preference for backward- or forward-facing seats. No demographic differences were found amongst seated passengers, but as load factor increased, men had higher probabilities of being standees compared to women. 90% seat utilization is only achieved at 120% load factor; furthermore, standing customers strongly prefer to crowd vestibule areas between doors (particularly in cars with symmetric door arrangements), and hold onto vertical poles. We recommended that future railcars where possible should ideally be designed with asymmetric door apertures, 2+2+2 partitioned longitudinal seats, and no stanchions or partitions near doorways. This study received substantial attention within the research community and spawned similar studies in other cities of customer seating preferences, including some employing survey and focus group methods, thereby indirectly improving railcar seating layouts in a number of U.S. cities.
Related Publications/Presentations:
Using Train Movement Data for Service Management
 We led the establishment of a program at a large public transit agency to routinely utilize historical and near-real-time train movement data for a variety of ad-hoc analyses in support routine service management and special projects. At that time, a vendor had just completed a major project to connect local control towers on the newer subway lines to a central operations control center, allowing visibility of movements along with train identification from one single database. Working with the vendor and the local I.T. and Signal departments, we arranged for automated nightly export and processing of the data from the isolated rail control network, making it available for routine analysis. One of the first application of this data was to replace the manual and burdensome random sample observations for auditing en-route service reliability with automatically collected data. We also utilized the data to monitor the day-to-day variability of station dwell times during busy periods, terminal departure timeliness, maintenance track outages, and to monitor the performance impacts of major service changes. This pioneering work prompted the agency to explore more of the passively collected data that had been available within their systems, and eventually led to similar projects that took data directly from relay rooms on the older parts of the system.
Related Publications/Presentations:
Organizational Development of Innovative Functions
 For a number of railway organizations, we were responsible for either developing a brand new team to perform a specific function that had hitherto not been performed in-house, or for reviewing an existing group that has had its regular function and responsibilities transformed so fundamentally that a new organizational structure was needed for it to be effective. In one case, we took a unit that had various data-related responsibilities such as surveying, reporting, datamining, big data analytics, regulatory compliance, and quantitative model development, and reorganized it such that the routine data production activities were separated from the research and development activities, and from the I.T. support functions that provided the computer infrastructure on top of which all of those activities took place. For another group, we designed the decentralized organization that would together support the enterprise geographic information system (GIS) by recommending that a small core companywide GIS group was supplemented by designated representatives (both existing and new staff) embedded within various other functional units that would offer the more specialized skills required within their department (e.g. land surveying, demographic analysis, engineering, archiving) but also serve as liaison to the central unit. In another case, we developed an industrial engineering and resource review function from scratch. We also worked on an organization plan that distributed certain compliance responsibilities to subject matter experts within the appropriate areas with one manager serving as overall coordinator. In many of these cases, our organizational plan was implemented, usually with minor modifications, by the business. In one last case, we were tasked with documenting the workflow, roles and responsibilities, and business processes of an existing organization with many ad-hoc and miscellaneous tasks in a detailed and defensible way, to forestall efforts by outside forces to dismantle the unit. We ultimately contributed to their success in preventing that team from being broken up, and helped others achieve a better understanding of that group.
Measuring and Controlling Subway Fare Evasion
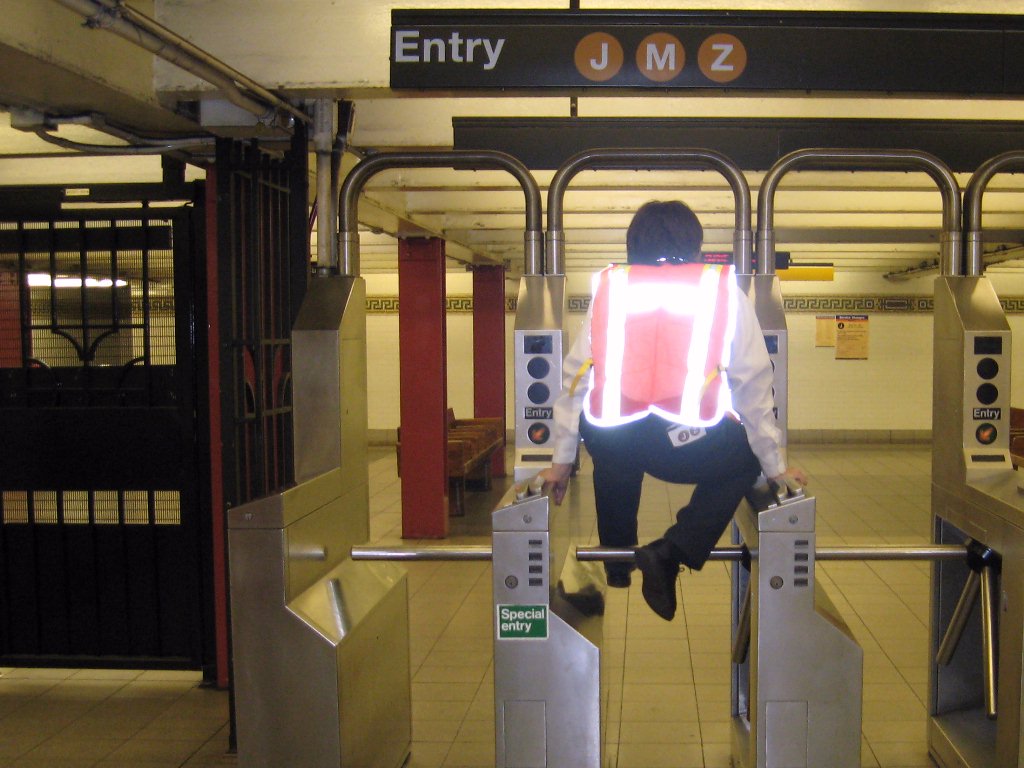 We were tasked by a major U.S. rapid transit system to determine the true rate of fare evasion at the turnstile, and assess the resulting potential revenue loss. Working in conjunction with a team of internal auditors, we adopted a stratified sampling methodology and developed methods for discreet (although not completely clandestine) observations at subway fare control areas. During this project, we discovered that the system in fact had a comprehensive pre-existing framework for managing and combating fare evasion, although it did not report any reliable statistics. The Automated Fare Collection (AFC) system actually features lessons learned from field trials of prototypes specifically designed to limit fare abuse. We found at that time the annual average subway evasion rate remained relatively low at approximately 1.3%, although there were distinct patterns by time of day, type of fare control, rider demographics, and geography. Evasion rate peaks at 3pm due to students dismissal, otherwise hovers around 0.9% peak, 1.9% off-peak. Busy times and locations have higher evasions per hour but lower evasions per passenger. More evasions occur in lower-income neighbourhoods. Staff presence apparently doesn’t reduce evasions. Perhaps counterintuitively, we recommended that fare evasion enforcement should focus on high volume stations and time-of-day to maximize deterrent effect. The transit agency implemented a continuing program to monitor the true rate of fare evasion following this audit, and addressed issues relating to fare structure, probability of enforcement action, versus fixed-penalty fines.
Related Publications/Presentations:
Workload Study for a Critical Railway Supervisory Function
On behalf of a large metro operator, we designed a time-and-motion study using statistical sampling methodologies to determine the typical residual workload of certain field supervisors whose primary train dispatching function had been “remoted” to a centralized control center. To properly understand their workflow, we met with control center managers and reviewed their operating rules to understand their function. We also met with supervisor representatives at their work locations to ensure we capture all of the exception tasks they perform on a day-to-day basis, and factored these unusual circumstances into our study design. A team of operations managers then performed field observations on a 24/7 basis over the course of two months based on our statistical sample. Our study showed that the field supervisors, although they were actively utilized only around 30% of the time, on average several times each shift, they perform a task that could not reasonably have been performed by the train crew, which would otherwise have required a roving supervisor to be sent from another location. We also found that they fulfilled an important safety function by determining fitness-for-duty at train crew signing-on points. As a result of our study, the operations management proactively identified 40 existing messenger positions, whose function could be replaced with internal mail service, which resulted in equivalent headcount reductions.
Demographic Analyses to Inform Transit Fare Policy
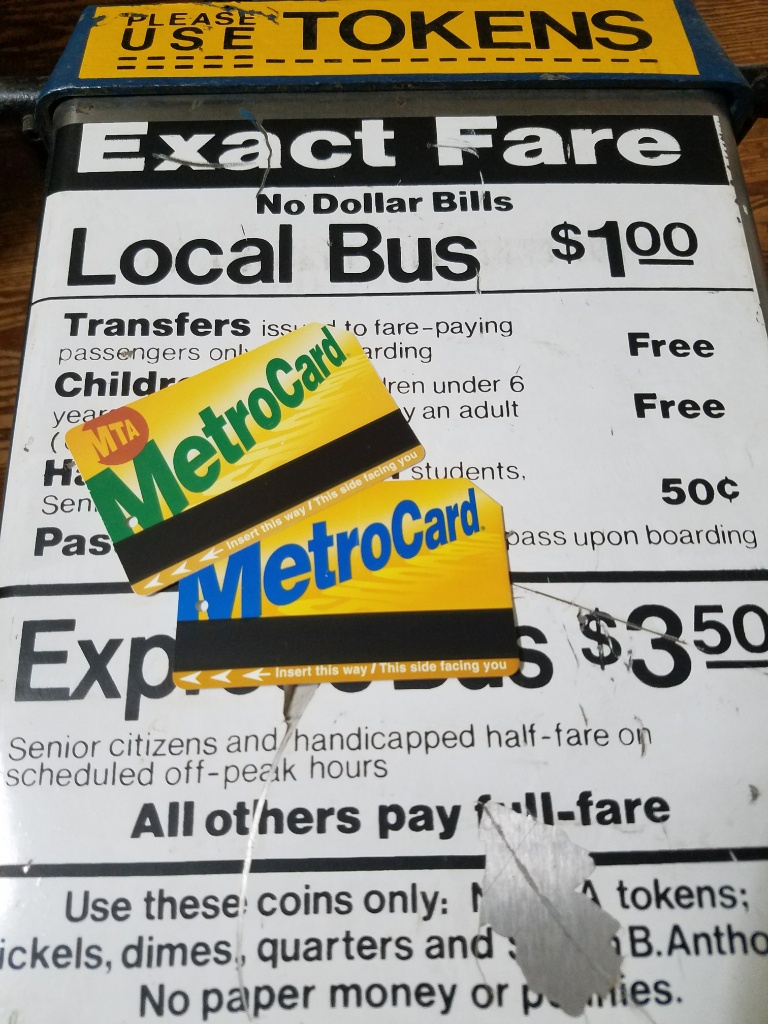 One major U.S. transit agency was proposing a significant round of fare restructuring in the face of a structural deficit, and many fare policy options were being considered. Some of these proposed fare structures involved significant increases and expected diversions of current customers between different fare products (e.g pay-per-ride tickets, discounted multi-ride tickets, and unlimited ride passes of differing durations), and an option to introduce higher peak fares was being discussed. This type of major change in fare structure was unusual in this metropolitan area and advocates were concerned about its equity impacts, as the proposals had the potential to shift the cost burden between different groups or geographic areas. We were tasked to combine existing fare media usage survey data, customer demographics data, U.S. Census data, and current farecard utilization data to determine impacts to different groups of customers, such as minority or low-income. For this assignment, we came up with two different approaches for impact analyses: a classical aggregate one based on known fare elasticities in the various markets, and an innovative disaggregate one utilizing all observed trips and individually simulating each rider’s choice of fare product based on the new fare structure and their daily travel pattern. From these results, the transit agency was able to choose a fare scenario that delivered the required revenue increases whilst minimizing impacts to protected demographics. These results were also provided to relevant authorities for establishing Title VI compliance of the fare restructuring process.
Related Publications/Presentations:
Developing Performance Measures for a New Management Framework
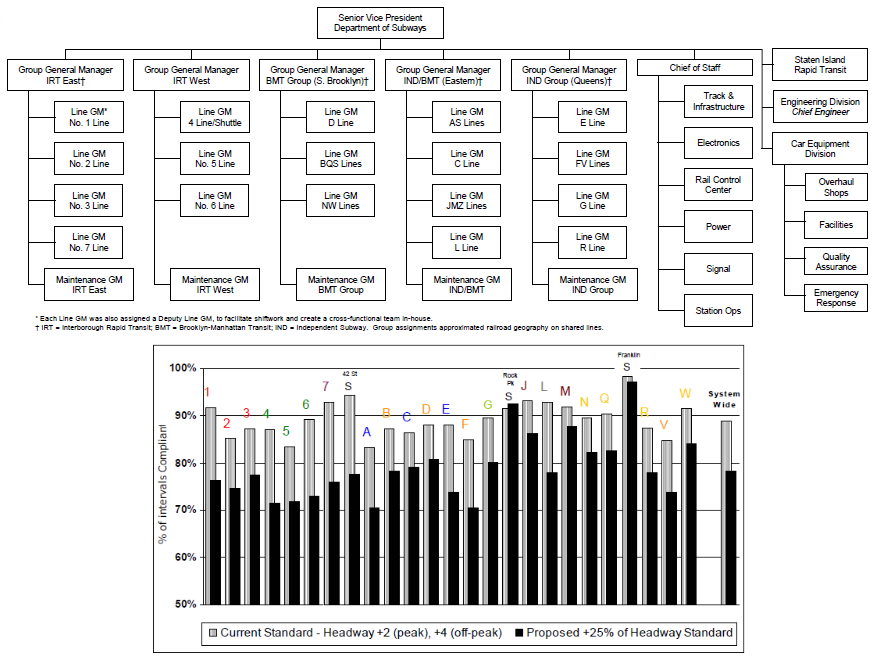 For a large public transit agency, we developed a series of aggregate performance measures using a balanced scorecard framework to support the roll-out of an operations management restructuring programme designed to provide a single point of accountability for service on each rail line. The rail lines have shared track segments where they share stations, and several lines would share major maintenance assets such as workshops. Additionally, trains may be subject to diversion onto other lines in case of operational perturbations, which in some cases are not an unusual occurrence. It was, therefore, necessary to report the composite performance of each line by allocating performance results which may be measured by station, by track segment, or for shared vehicle fleets. We developed a weighting scheme by utilizing usage statistics by line, and by utilizing existing “performance priority” data from a prior customer survey to inform which aspects of performance is more important to the customer (e.g. station cleanliness versus car reliability). This resulted in a composite performance measure which allowed overall performance of all lines to be presented in rank order. While the analytics behind the weighting scheme are not complicated, the most challenging aspect of this project was to gain acceptance of the proposed performance measures amongst the new line general managers whose performance would be so adjudicated, and we consider their acceptance of our proposal an important achievement.
Related Publications/Presentations:
International Metro Benchmarking on Governance Frameworks
 As a spin-off of a national research and training program, we were tasked to determine through publicly available information why many South East Asian transit properties visited by the program delegation have reportedly positive cash flows, i.e. are “profitable”. We found through a detailed comparative analysis of demand densities, asset utilization, regulatory frameworks, performance regimes, operating practices, and softer cultural factors that in fact only the “prudent commercial” portion of the Hong Kong Mass Transit Railway were profitable in the purest sense where farebox revenues exceeded operating expense plus the long term cost of capital renewal. In other cities, the operators are more akin to concessioned carriers or management contractors where at least some infrastructure costs were separated from the operating entity using a variety of financial devices. These systems also received various real estate grants in transactions reminiscent of U.S. “land grant” railroads and have more autonomy and commercial freedom to develop their transit-oriented property holdings. Large metro systems in the U.S. had made network design choices with consequences in density and utilization, which explain some of the higher productivities observed in Asia. We conclude that direct comparisons in performance, profitability, and productivity should be avoided unless care is taken to analyze impacts of governance, social contexts, design criteria, and reasons for these differences. Nonetheless, we believe benchmarking exercises can yield valuable insights for operations improvement under prevailing local constraints.
Related Publications/Presentations:
Transport Equity Analyses for Major Service Changes
 On behalf of a major U.S. public transit agency, we developed analytical methodologies and performed demographic analysis to determine the impact of proposed service changes on protected customer groups (minority and low-income). At that time, a large package of bus service changes was being considered, including changes in service span, route, frequency—which also resulted in specific impacts in load factors, access distance, and other performance metrics that are monitored under the agency’s own service standard and various regulatory requirements. Changes were also proposed for several rail lines. For each proposed service change action, we determined whether it met the “major service change” threshold. If it did, we determined through demographic analysis of likely users as to whether the change impacted the protected groups disproportionately. From these results, the agency was able to modify proposed service changes to avoid impacting protected groups while achieving the required cost reductions. These results were also provided to relevant authorities for establishing Title VI compliance of the service change process.
Related Publications/Presentations:
Shared Use of Railroad Infrastructure: Practical Field Research
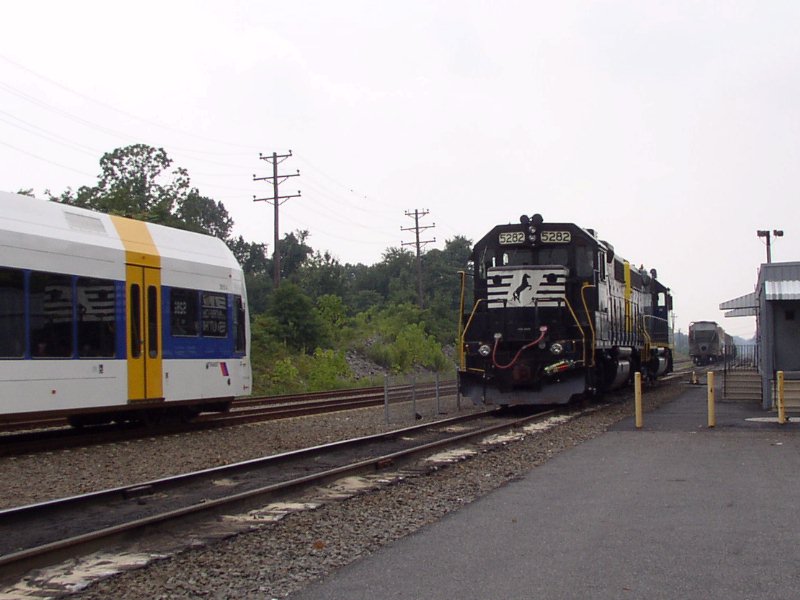 For a national transit research program, we were responsible for researching and writing a report on the shared use of railroad infrastructure by non-compliant light rail vehicles. At that time, the use of Federal Railroad Administration (FRA) waivers for operating light rail cars on general system of railroads was in its nascent years, and the concept of temporal or spatial separation was still in development. As part of this project, we visited a number of properties that have existing waivers. Through interviews with stakeholders, technical specialists, and transit managers, we determined the essential elements and conditions that allowed the system to operate safely and likely receive FRA waiver approval. We identified suitable train control technologies, their performance, costs, and operational impacts. We also determined common procedural and regulatory approaches, and methods for costsharing, staffing, and emergency recovery.
Related Publications/Presentations:
- Shared Use of Railroad Infrastructure with Noncompliant Public Transit Rail Vehicles: A Practitioner’s Guide
- Business Model for Commingled Operations of Freight and Non-FRA-Compliant Passenger Rail Services
Note: Alex Lu performed this work as an employee of another firm.
Management Support for Stop Elimination and Performance Initiatives
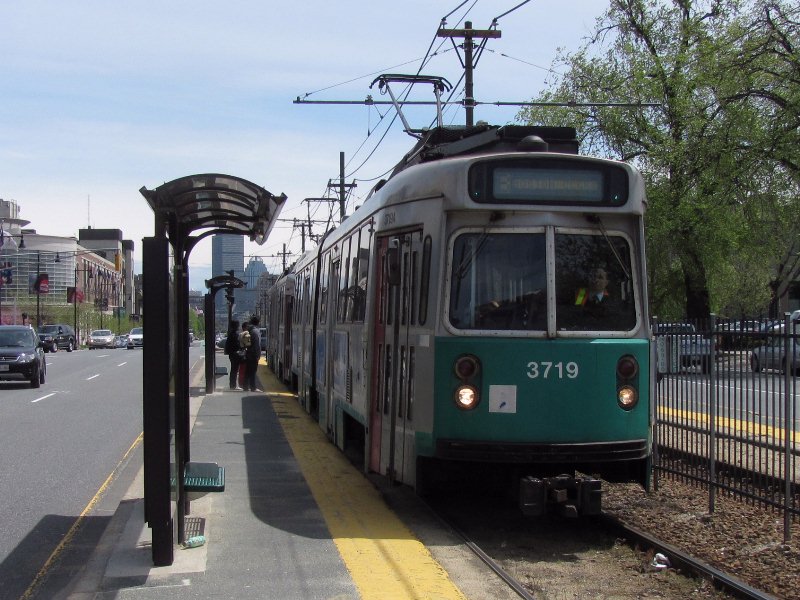
For a multi-model regional transit authority, we provided analytical and project support for a line manager who sought to accomplish two goals: eliminate several underutilized stops on a trolley line, and improve en-route timekeeping at key interchange stations. We identified the target stops to be eliminated using a composite scoring method on several criteria: daily patronage, distance to adjacent alternative stops, and proximity to major demand generators that serves limited-mobility populations. Stops that we identified were subject to a closure process beginning with six month temporary service suspension following public consultation. For on-time performance improvements, we designed schedule “paddles” similar to those carried by railroad enginemen in Asia, which provided quick reference of scheduled times at intermediate timing points. We also provided updated “simplifier” sheets to en-route supervisors (similar to a pre-printed train register), which made it easier for each supervisor to determine whether a trolley was running early or late at their location, or if an interval had been missed entirely by the departure terminal. The on-time performance initiatives proved too resource-heavy for production implementation, however, the elimination of underutilized stops did result in slight journey time improvements with minimal impact to total ridership.
Visual Interfaces for Real-Time Customer Information Systems
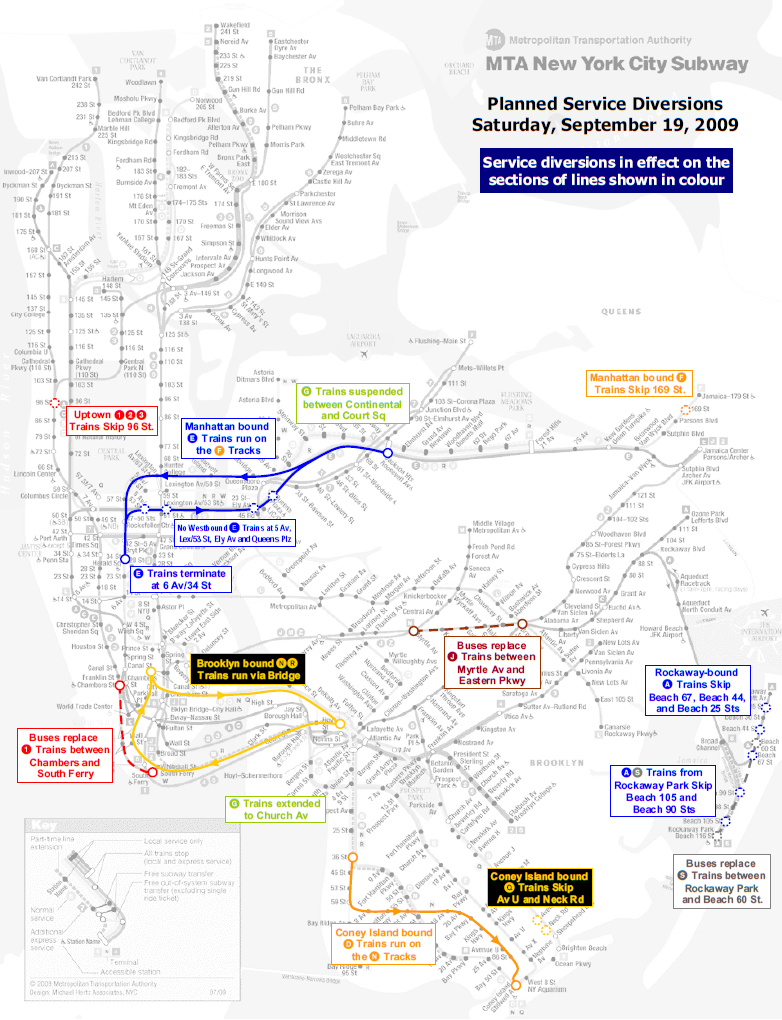
 For a subway line general manager (LGM), we designed and prototyped customer communication visual interfaces for use at senior management meetings where these alternatives were debated and systemwide standards set. At that time, the subway was being managed as a number of stand-alone lines and each LGM were responsible for their own area as well as pushing initiatives to improve systemwide best practices. We provided prototypes for a map capable of communicating planned service changes, and an interface for a customer information system (designed for use in subway stations) capable of displaying system status in real time, as a strategy to promulgate this practice. We performed industry-wide research to ascertain if similar products already existed and sought to keep the design consistent with other operator where this was possible. However, due to the uniquely complex subway system in this city, this was not possible for the service change map, and a brand new design had to be created. The real-time status display was based on systems already in common use within the airline and mainline passenger railroad industries, giving customers a sense of familiarity. Later we provided a functioning prototype to assist decisionmakers in visualizing and advancing a pilot project. In both cases, the communication initiatives advanced by the LGM were eventually adopted by the system and further development by outside vendors took place based on our prototype designs.